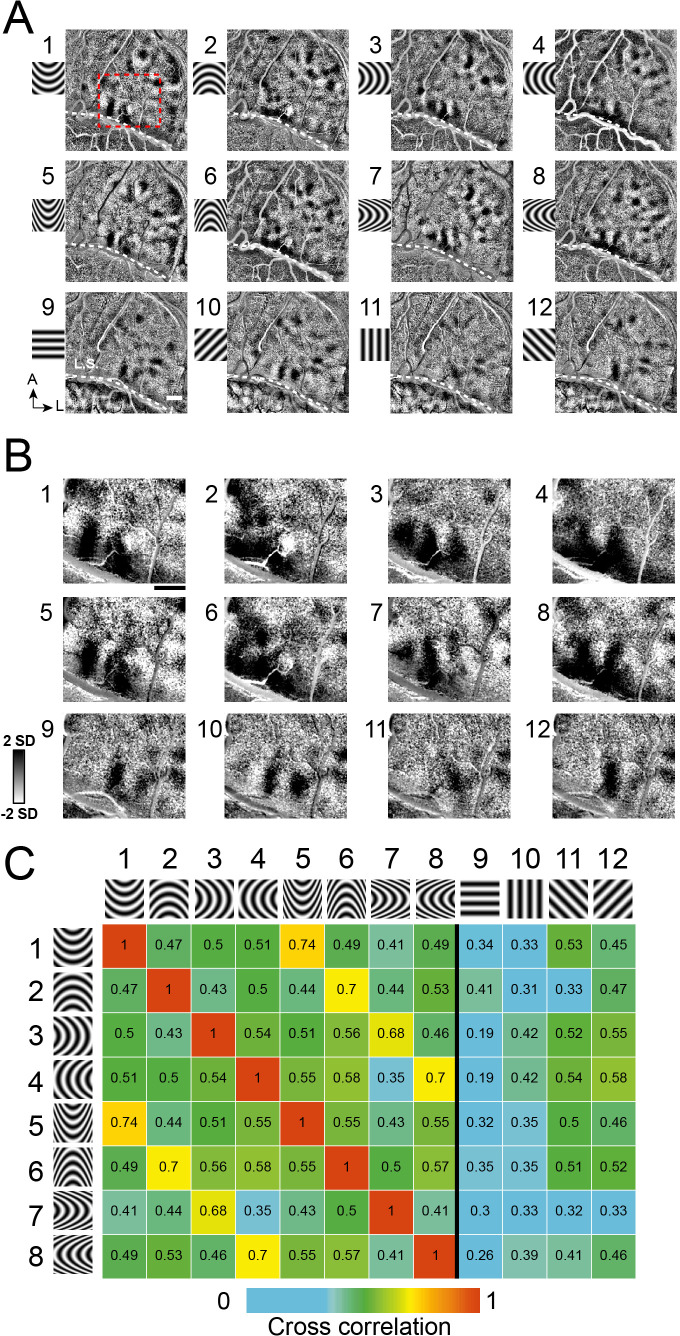
Figure 4. Systematic maps of curvature orientation.
(A) Imaging results of the responses to different curvature orientations. Maps of curvature minus average of straight gratings (Case 2). 1–4: low curvature degree, a/b ratio = 2, 5–8: high curvature degree, a/b ratio = 5. 1,5: upwards. 2,6: downwards. 3,7: leftwards. 4,8: rightwards. 9–12: straight. (B) Enlarged view of the cortical region outlined by red dotted box in A. (C) Correlation values for pairs of maps (from A). Maps of similar curvature orientation have high correlation values, while those with different curvature orientations have low correlation values. Colors code correlation values (high, red, to low, blue, see color bar).

