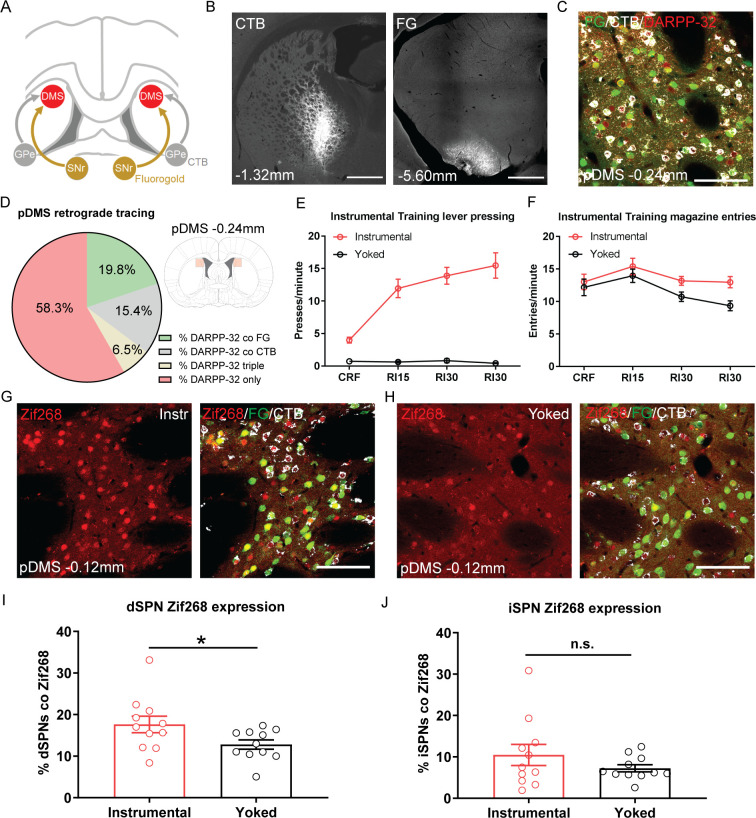
Figure 1. The acquisition of goal-directed actions induces response-specific expression of Zif268 in direct spiny projection neurons (dSPNs) in the posterior dorsomedial striatum (pDMS).
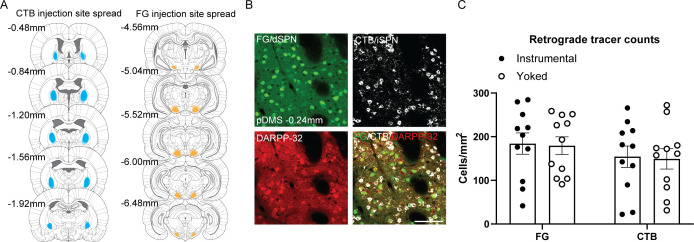
(A) Schematic illustrating the surgery design for retrograde tracing. Rats received bilateral infusions of the retrograde tracers fluorogold (FG) and cholera-toxin B (CTB) into the substantia nigra pars reticulata (SNr) and globus pallidus (GPe) respectively. (B) Fluorescent confocal images showing injection sites of CTB (left) and FG (right) in the GPe and SNr respectively; scale bars, 1000 µm. (C) Fluorescent confocal image taken from one 40 µm coronal section in the pDMS, illustrating fluorescence labelling of DARPP-32 (red), FG (green), and CTB (white); scale bar, 100 µm. (D) Percentages represent the proportion of total DARPP-32 positive SPNs that also express FG or CTB in the pDMS (imaging region indicated in pale red, right). Data presented are mean percentages for 22 rats, averaged across hemispheres. (E) Mean (± SEM) lever presses per minute averaged across each day of instrumental or yoked training for each group. (F) Mean (± SEM) magazine entries per minute averaged across each day of instrumental or yoked training for each group. (G) Fluorescent confocal image of a coronal 40 µm section for an instrumentally trained rat; left image shows Zif268 expression (red), and right image shows the same merged with FG labelled dSPNs (green) and CTB labelled indirect spiny projection neurons (iSPNs; white); scale bar, 100 µm. (H) Same as G but for a yoked trained rat. (I) Percentage of labelled dSPNs that were co-labelled with Zif268 for each rat in Group Instrumental and Group Yoked. Data presented are means of four pDMS sections per rat. Bars represent group means ± SEM. (J) Same as I but for iSPNs. *p<0.05.


