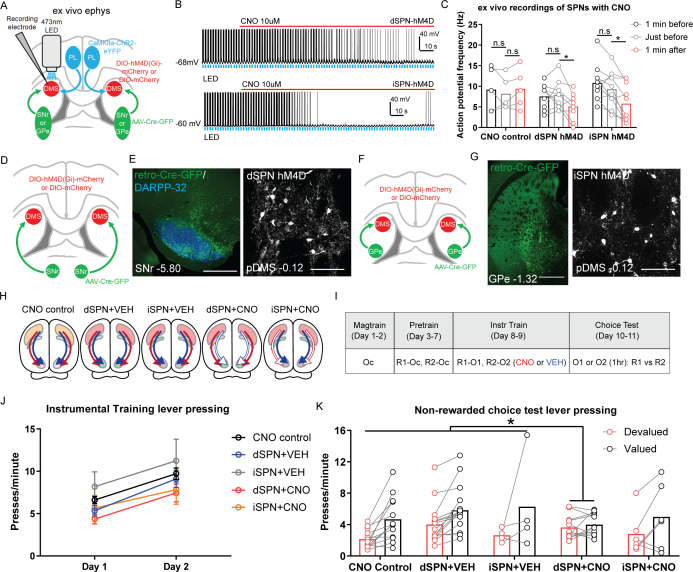
Figure 2. Goal-directed learning is disrupted by chemogenetic inhibition of direct spiny projection neurons (dSPNs) but not indirect spiny projection neurons (iSPNs) in the posterior dorsomedial striatum (pDMS).
(A) Schematic depicting the viral injections for ex vivo slice electrophysiology recordings; retro-Cre was injected into the substantia nigra pars reticulata (SNr) or globus pallidus (GPe), DIO-hM4D or DIO-mCherry was injected into the pDMS and ChR2-eYFP injected into the PL; direction of arrows indicates retrograde or anterograde transport of the virus. (B) Example trace from one recorded dSPN (top) and one recorded iSPN (bottom) expressing DIO-hM4D. Upward deflection black lines represent action potentials, which were elicited by the pulsing of a 473 nm wavelength LED light (blue) onto corticostriatal terminals (see Materials and methods). The red line indicates the time period when 10 µM clozapine-N-oxide (CNO) solution was added to the extracellular solution. (C) Action potential frequency of dSPNs and iSPNs elicited by light-evoked terminal glutamate release from ChR2-containing corticostriatal axons in the pDMS 1 min before (black), immediately before (grey) and 1 min after (red) the application of CNO in the extracellular solution. Each data point represents individually recorded cells. (D) Schematic depicting the viral injections to target dSPNs; retro-Cre was injected bilaterally into the SNr and DIO-hM4D or DIO-mCherry was injected bilaterally into the pDMS. (E) Confocal image (scale bar, 1000 µm) from one rat showing retro-Cre expression in the SNr (left) and a representative confocal image (scale bar, 100 µm) showing DIO-hM4D expression in pDMS dSPNs (right). (F) Same as D but for targeting iSPNs; retro-Cre was injected into the GPe. (G) Same as E but showing retro-Cre expression in the GPe and DIO-hM4D expression in pDMS iSPNs. (H) Summary of experimental groups; blue arrows indicate intact direct pathway function, red arrows indicate intact indirect pathway function, and unfilled arrows indicate inhibited pathway. (I) Summary of the experimental design; R1 and R2 indicate left and right lever responses; Oc, O1, and O2 indicate distinct food outcomes; CNO and VEH indicate injections of clozapine-N-oxide or vehicle, respectively. (J) Mean (± SEM) lever presses per minute averaged across each day of instrumental training for each group. (K) Mean lever presses per minute on the devalued and valued lever for each rat in each group, averaged across two choice tests under extinction. For all data, bars represent group means. *p<0.05.


