. 2020 Nov 20;9:e58544. doi: 10.7554/eLife.58544

Figure 4. Bilateral optogenetic inhibition of direct spiny projection neurons (dSPNs) or indirect spiny projection neurons (iSPNs) leaves the expression of goal-directed learning intact but unilateral inhibition of dSPNs biases performance.

(A) Schematic depicting the design for ex vivo recordings; retro-Cre was injected into the substantia nigra pars reticulata (SNr) or globus pallidus (GPe) and DIO-eNpHR into the posterior dorsomedial striatum (pDMS); direction of arrows indicates retrograde transport of the virus. (B) Example trace from one dSPN (top) and iSPN (bottom) expressing eNpHR recorded under current-clamp with an injection of +50 or +100 pA current (200 ms, 0.5 Hz). Orange bar denotes time period when 625 nm LED was applied to the neuron (40 Hz, 150 s). Bottom three panels of each SPN are expanded traces from the above at time points before (1), during (2), and after (3) LED illumination. (C) Action potential frequency of eNpHR-labelled SPNs (four dSPNs and five iSPNs) at baseline (10 s period before LED) versus LED (10 s period from beginning of LED). (D) Surgery design for targeting dSPNs; retro-Cre was injected bilaterally into the SNr and DIO-eNpHR or DIO-eYFP was injected bilaterally into the pDMS. Cannulae were inserted bilaterally into the pDMS. (E) Confocal image (scale bar, 100 µm) showing DIO-eNpHR expression in pDMS dSPNs. (F and G) Same as D and E but for pDMS iSPNs; retro-Cre was injected into the GPe. (H) Summary of experimental groups; blue arrows indicate intact direct pathway, red arrows indicate intact indirect pathway, and unfilled arrows indicate inhibited pathway. (I) Summary of the experimental design; R1 and R2 indicate left and right lever responses; Oc, O1, and O2 indicate distinct food outcomes; LED ON versus OFF indicates training or test days when LED light was delivered. (J) Mean (± SEM) lever presses per minute averaged across each day of instrumental training for each group. (K) Mean presses per minute on the devalued and valued lever for each rat in each group, averaged across two tests, during LED ON (orange shaded) and LED OFF (non-shaded) periods. (L) Continuation of I. (M) Same as H but showing unilateral LED manipulation. (N) Mean presses per minute on the lever ipsilateral and contralateral to unilateral inhibition for each rat in each group during periods of LED ON (orange shaded) and LED OFF (non-shaded), averaged across two tests with inhibition in each hemisphere. (O) Mean proportion of responding on the ipsilateral and contralateral lever during the LED ON period, as a proportion of the total responding on each respective lever, for each animal in each group, averaged across two tests. For all data, bars represent group means. *p<0.05, **p<0.01.

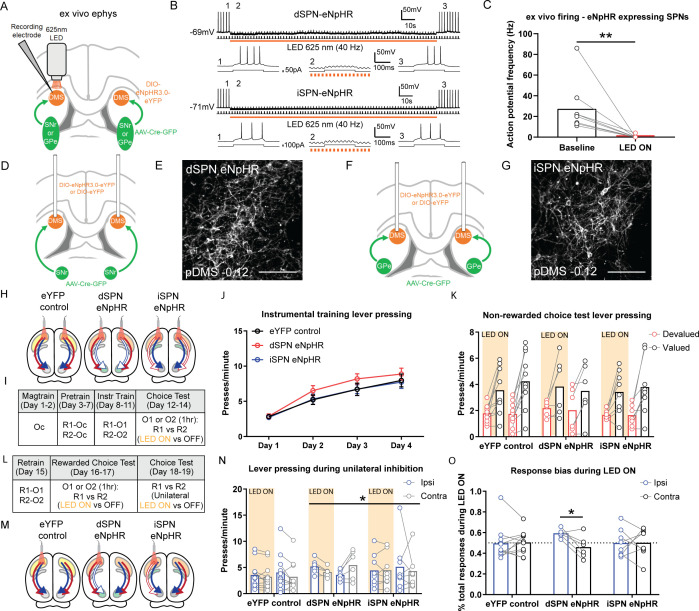
Figure 4.

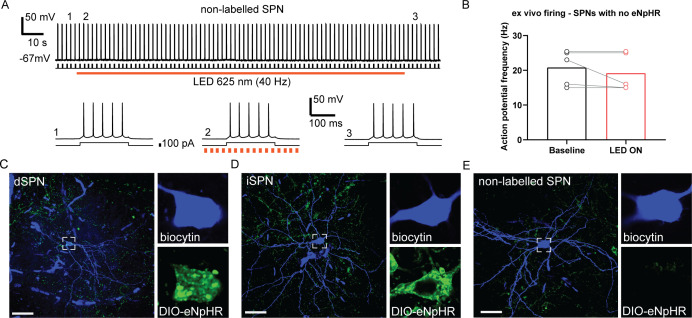
Figure 4—figure supplement 1. Verification of cellular expression and non-labelled SPN activity for the optogenetic inhibition experiment.

Figure 4—figure supplement 1.

(A) A representative raw trace of a non-halorhodopsin-positive spiny projection neuron (SPN) recorded under current-clamp with an injection of +100 pA current (duration 200 ms pulse, triggered at 0.5 Hz) to evoke action potentials. Orange bar directly below denotes time period when LED 625 nm was applied to the neuron pulsing at 40 Hz for 150 s. Bottom three panels are expanded traces from the above at time points before (1), during (2), and after (3) LED illumination. The SPN was resting at −67 mV. (B) Action potential frequency of non-halorhodopsin labelled SPNs (n=5) at baseline (10 s time period before LED) versus LED illumination (10 s time period from the beginning of LED). (C) Biocytin (blue)-labelled dSPN with halorhodopsin (green) expression from recording in Figure 4B (top trace) (scale bar, 30 µm). (D) Biocytin (blue)-labelled iSPN with halorhodopsin (green) expression from recording in Figure 4B (bottom trace) (scale bar, 30 µm). (E) Biocytin-labelled SPN without halorhodopsin expression from cell recording in A.
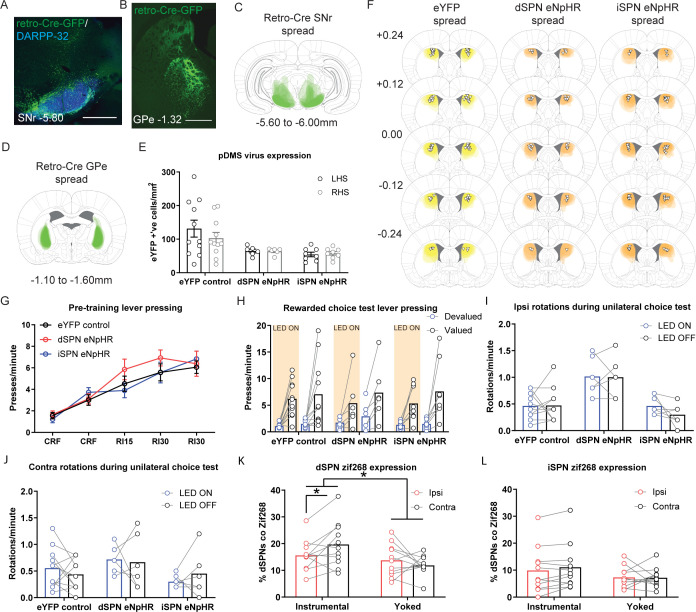
Figure 4—figure supplement 2. Verification of the eNpHR virus and supplemental behavioral data related to the optogenetic inhibition experiment.

Figure 4—figure supplement 2.

(A) Confocal image (scale bar, 1000 µm) from one rat showing retro-Cre expression in the substantia nigra pars reticulata (SNr). (B) Same as A but image shows retro-Cre expression in the globus pallidus (GPe). (C) The extent of retro-Cre spread in the SNr, imaged at the widest point of expression for all included animals. (D) Same as C but schematic shows the extent of retro-Cre spread in the GPe. (E) Total number of eYFP positive cells/mm2 in left and right posterior dorsomedial striatum (pDMS) for each rat in each experimental group. Bars represent group means ± SEM. (F) Extent of DIO-eYFP (left), DIO-eNpHR in direct spiny projection neurons (dSPNs; middle) and DIO-eNpHR in indirect spiny projection neurons (iSPNs; right) for all included animals in each group, imaged at five different AP locations encompassing where virus expression is at its widest. Triangles represent locations of cannula placements for each rat. (G) Mean (± SEM) lever presses per minute averaged across each day of instrumental pre-training for each group. (H) Mean lever presses per minute on the devalued and valued lever for each rat in each group during LED ON (orange shaded) and LED OFF (non-shaded) periods, averaged across 2 days of rewarded choice tests. (I) Mean number of ipsilateral rotations (relative to hemisphere of LED light delivery) per minute for each rat in each group, averaged across two tests during LED ON and LED OFF periods. (J) Same as I but for contralateral rotations (relative to hemisphere of LED light delivery). (K) Data from SPN activity marker experiment (Figure 1) showing the percentage of labelled dSPNs that were co-labelled with Zif268 for each rat in Group Instrumental and Group Yoked in the hemisphere ipsilateral to lever position and contralateral to lever position. Data presented are means of four pDMS sections per rat. (L) Same as K but for iSPNs. For all data, bars represent group means *p<0.05.