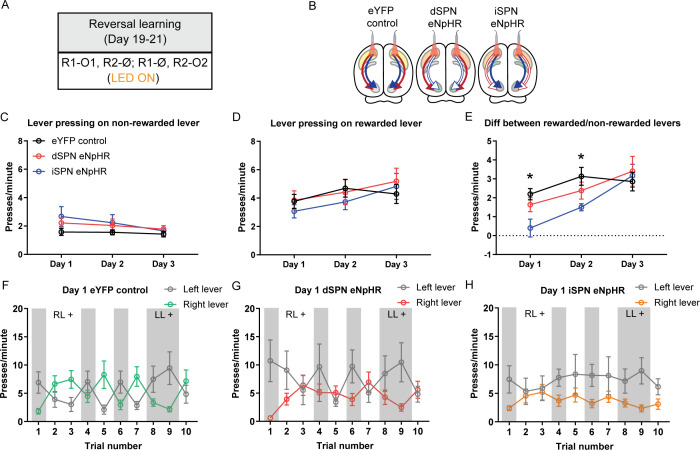
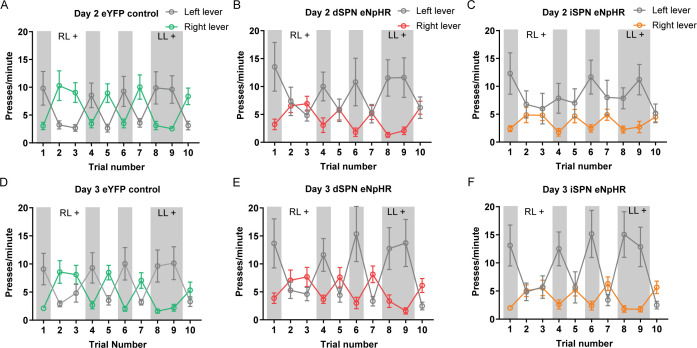
Figure 5. Optogenetic inhibition of indirect spiny projection neurons, but not direct spiny projection neurons, in the posterior dorsomedial striatum impairs response flexibility.
(A) Summary of the experimental design; R1 and R2 indicate left and right lever responses; O1 and O2 indicate distinct food outcomes; Ø indicates non-rewarded responses; LED light was delivered during all lever presentations. (B) Summary of experimental groups; blue arrows indicate intact direct pathway function, red arrows indicate intact indirect pathway function, and unfilled arrows indicate inhibited pathway. (C) Mean (± SEM) presses per minute on the non-rewarded lever across 3 days of reversal training in all groups. (D) Mean (± SEM) presses per minute on the rewarded lever across 3 days of reversal training in all groups. (E) Mean (± SEM) difference in press rate (expressed as presses per minute) between the rewarded and non-rewarded levers for each group. (F–H) Mean (± SEM) lever presses per minute on the left lever and right lever for rats in each group on Day 1 of training, averaged across each 2.5 min trial – grey-shaded regions indicate trials in which the left lever was rewarded (LL+) and non-shaded regions indicate trials in which the right lever was rewarded (RL+). *p<0.05.


