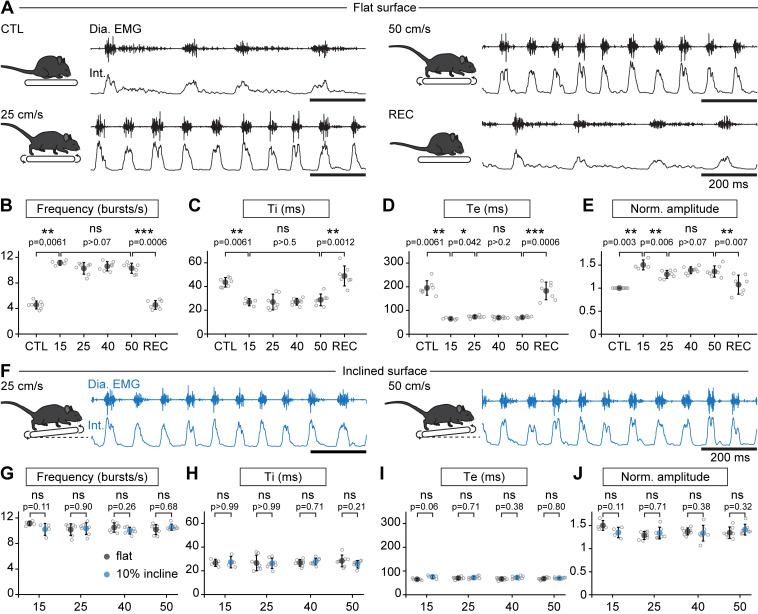
Figure 2. Breathing rate augments during trotting independently of limb velocity or surface inclination.
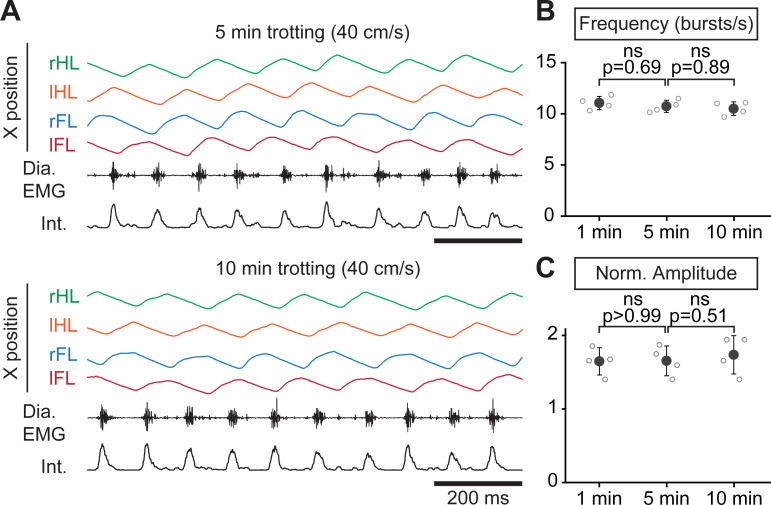
(A) Diaphragm activity recordings in control condition (CTL), trotting at 25 and 50 cm/s and during recovery after the run (REC). Raw (Dia. EMG) and integrated (Int.) signals are illustrated in each condition. (B–E) Analysis of respiratory parameters in control condition, and during trot at 15, 25, 40, and 50 cm/s, and during recovery: frequency (B), inspiratory (Ti, C) and expiratory (Te, D) times and normalized amplitude (E). Data are mean ± SD from n = 7 mice per condition for all speeds except at 15 cm/s (n = 4) where three animals had unstable running and were discarded. p values indicated are obtained from Mann-Whitney U tests and considered not significant (ns) when p>0.05. (F) Raw (Dia. EMG) and integrated (Int.) diaphragmatic activity recordings during trot at 25 and 50 cm/s on a treadmill with 10% incline. (G–J) Similar analyses as in (B–E) during running on the inclined treadmill (blue) compared to the values on the flat treadmill (black). p values indicated are obtained from Mann-Whitney U tests and considered not significant when p>0.05. See Figure 2—figure supplement 1 for a similar analysis during a 10-min run.


