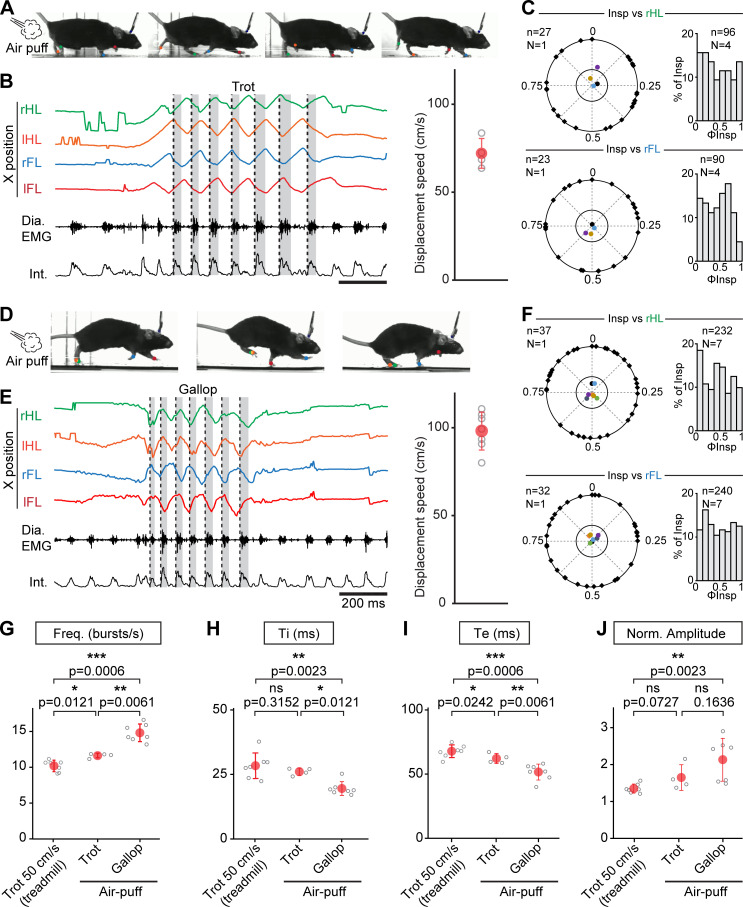
Figure 4. Further augmentation of breathing rate yet without temporal correlation of breaths to strides during escape running, including at gallop.
(A) Side views of one representative mouse during air puff induced trot where right and left hindlimbs (rHL, green; lHL, orange) and forelimbs (rFL, blue; lFL, red) are alternating. (B) Changes in the horizontal (X) axis of the limbs over time as well as raw (Dia. EMG) and integrated (Int.) diaphragmatic neurograms are shown before and during four cycles of trot induced by air puff. Dotted black lines indicate the onsets of inspiratory bursts and shaded areas highlight inspiratory times. On the limb coordinates, rapid deflections before the onset of movement are occasional failures in detecting the paws at rest. The graph to the right shows the average running speed of each animal (gray open circles) and the mean ± SD across animals (in red) during air puff induced trot. (C) Circular plots showing the phase-relationship between n inspiratory bursts and the indicated reference limb for one representative animal (black diamonds on the outer circle). The black dot indicates the mean orientation vector for that animal and the colored dots indicate the mean orientation vector for three other animals. The positioning of these mean values within or close to the inner circle illustrates the absence of a significantly oriented phase preference (R < 0.3, with R being the concentration of phase values around the mean as defined in Kjaerulff and Kiehn, 1996). Bar-graphs to the right are distribution histograms of the phases of inspiratory bursts and the same reference limb for all n events from N = 4 animals. (D–F) Same representation as (A–C) during air puff induced gallop where right and left hindlimbs are now synchronized and right and left forelimbs are alternating. The average displacement speed of the animals at gallop (98 ± 11 cm/s) is significantly higher than at trot (72 ± 8 cm/s, p=0.0121, Mann-Whitney U test). Circular plots and distribution histograms are obtained from N = 7 animals. (G–J) Changes in respiratory frequency (G), inspiratory (Ti, H) and expiratory (Te, I) times and normalized amplitude (J) between trot at 50 cm/s on the treadmill, and air puff induced trot and gallop. Note that breathing rate is most significantly increased at gallop. Data are presented as mean ± SD (trot treadmill: N = 7 mice; trot air puff: N = 4 mice; gallop air puff N = 7 mice) and p values indicated are obtained from Mann-Whitney U tests.

