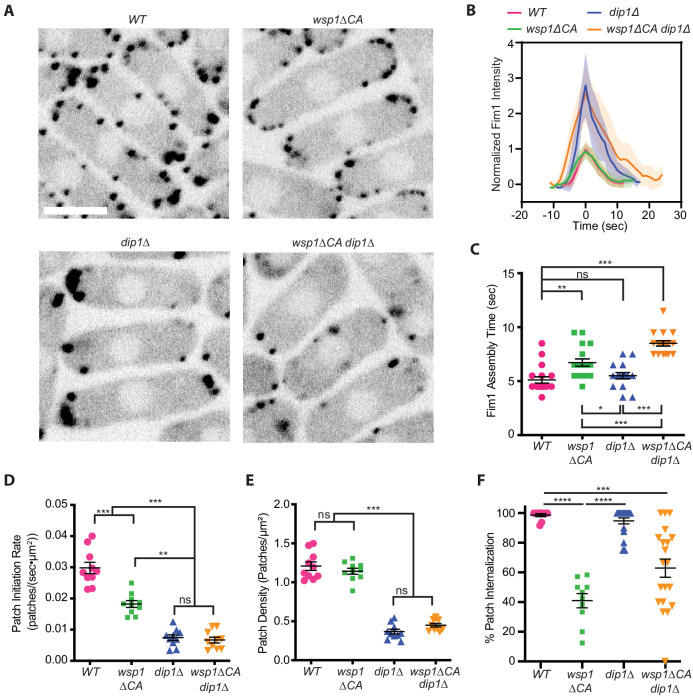
Figure 1. Wsp1 plays a role in the initiation of endocytic actin patches.
(A) Equatorial plane images of Fim1-GFP in Schizosaccharomyces pombe cells taken using spinning disk confocal microscopy. Scale Bar: 5 µm. (B) Plot showing the relative Fim1-GFP intensity in S. pombe mutant endocytic patches over their lifetimes. Traces represent the average of 16–18 endocytic patches. Intensity plots were aligned based on their peak values and normalized based on the peak value of the Fim1-GFP signal in the wild-type strain. Standard deviation is shown as shaded region around each trace. (C) Plot comparing the assembly time of Fim1-GFP in endocytic patches in wild-type cells to wsp1∆CA, dip1∆, and wsp1∆CA dip1∆ mutants. Error bars: standard error from 16 to 18 patches. (D) Plot comparing the endocytic patch initiation rate in wild-type cells to wsp1∆CA, dip1∆, and wsp1∆CA dip1∆ mutants. Error bars: standard error from 10 cells. (E) Plot comparing the endocytic actin patch density in wild-type cells to wsp1∆CA, dip1∆, and wsp1∆CA dip1∆ mutants as determined based on the number of Fim1-GFP-marked cortical puncta. Error bars: standard error from 10 cells. (F) Plot showing the percentage of endocytic patches internalized in wild-type and mutant S. pombe cells. Error bars: standard error from 10 to 22 cells. p-values: *<0.05, **<0.01, ***<0.001.


