. 2020 Nov 12;9:e60419. doi: 10.7554/eLife.60419

Figure 4. Wsp1-bound monomer recruitment accelerates multiple steps of the Dip1-mediated activation pathway.

(A) Simplified kinetic model of synergistic activation of Arp2/3 complex by Dip1 and Wsp1 based on the Dip1 alone ‘one monomer-binding’ activation pathway from Figure 3B. Note that Wsp1-VCA is not explicitly included in the model. Rate constants boxed in green were floated to fit time courses of reactions that contained both Dip1 and monomeric Wsp1-VCA. The purpose of this simplified model is to test the potential influence of Wsp1-mediated actin monomer recruitment on the steps of Dip1-mediated activation of Arp2/3 complex highlighted in E. (B) Plot of time courses of polymerization of 3 µM 15% pyrene-labeled actin in the presence of 50 nM SpArp2/3 complex, 1 µM Wsp1-VCA, and a range of Dip1 from 0.5–10 µM (solid colored lines). Dashed lines over each trace indicate the best fits from the model where only the off rate constant of the actin monomer bound to Dip1-Arp2/3 complex (k−10) was floated. (C) Objective values obtained from models floating the indicated parameters. The objective value represents the normalized mean square weighted sum of squares (see Materials and methods). (D) Plot of time courses shown in B with dashed lines over each trace indicating the best fits from a model in which k−9, k−10, and k11 were floated. (E) Depiction of the steps in Dip1-mediated activation of Arp2/3 complex that may be influenced by monomer recruitment. Dashed red lines in A and E indicate the nucleation competent state.

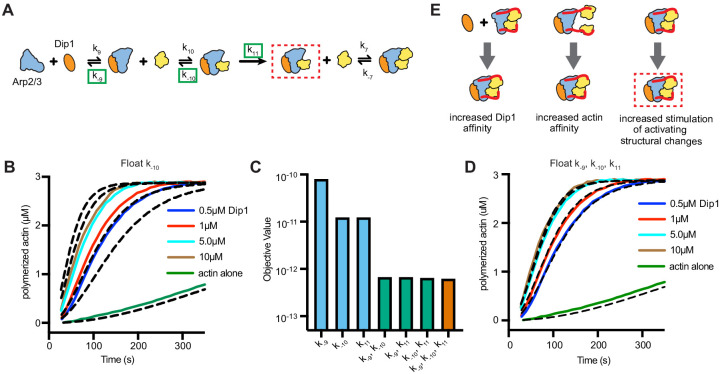
Figure 4—source data 1. Source data for pyrene actin polymerization time courses and simulations in Figure 4.

Figure 4.

Figure 4—figure supplement 1. Floating the association rate constants k9 and k10 in kinetic simulations of synergistic activation by Dip1 and Wsp1.

Figure 4—figure supplement 1.

(A) Simplified kinetic model of synergistic activation of Arp2/3 complex by Dip1 and Wsp1 based on the Dip1 alone ‘one monomer-binding’ activation pathway from Figure 3B. Note that Wsp1-VCA is not explicitly included in the model. Rate constants boxed in green were floated to fit time courses of reactions that contained both Dip1 and monomeric Wsp1-VCA. (B) Objective values obtained from models floating the indicated parameters. The objective value represents the normalized mean square weighted sum of squares (see Materials and methods).
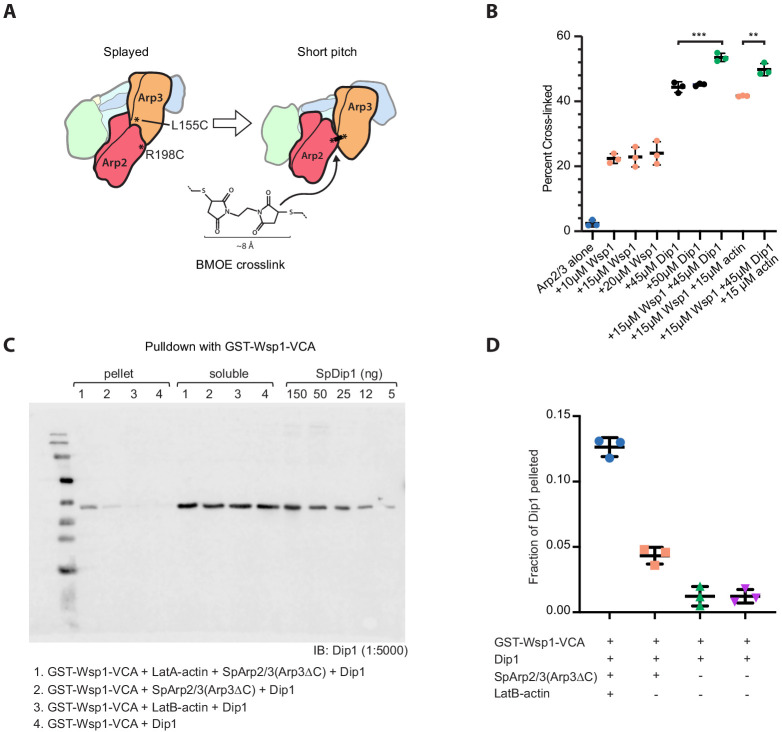
Figure 4—figure supplement 2. Additional experimental methods to determine how Wsp1 accelerates Dip1-mediated activation of Arp2/3 complex.

Figure 4—figure supplement 2.

(A) Schematic of short pitch crosslinking assay using dual cysteine engineered Arp2/3 complex and bis-maleimidoethane (BMOE). (B) Quantification of western blots of crosslinking reactions in which BMOE was added to a dual cysteine engineered Arp2/3 complex (1 μM) and 200 μM ATP in the presence or absence of 10–20 μM Wsp1-VCA, 45–50 μM Dip1, and 15 μM LatA-actin, as indicated. Reactions were incubated for 1 min at room temperature. Error bars show standard deviation. p-values: **<0.1, ***<0.001. (C) Western blot of GST-Wsp1-VCA pulldown assays. Binding reactions contained 235 μM GST-Wsp1-VCA on glutathione sepharose beads, 50 μM Dip1, 9.1 μM SpArp2/3(Arp3ΔC) complex, and 25 μM LatB-actin (from rabbit skeletal muscle) as indicated. The SpArp2/3(Arp3ΔC) mutant complex was used for these assays because it binds more tightly to Wsp1-VCA (Rodnick-Smith et al., 2016a). (D) Quantification of the fraction of Dip1 pelleted in reactions described in C. Error bars show the mean with standard deviation.