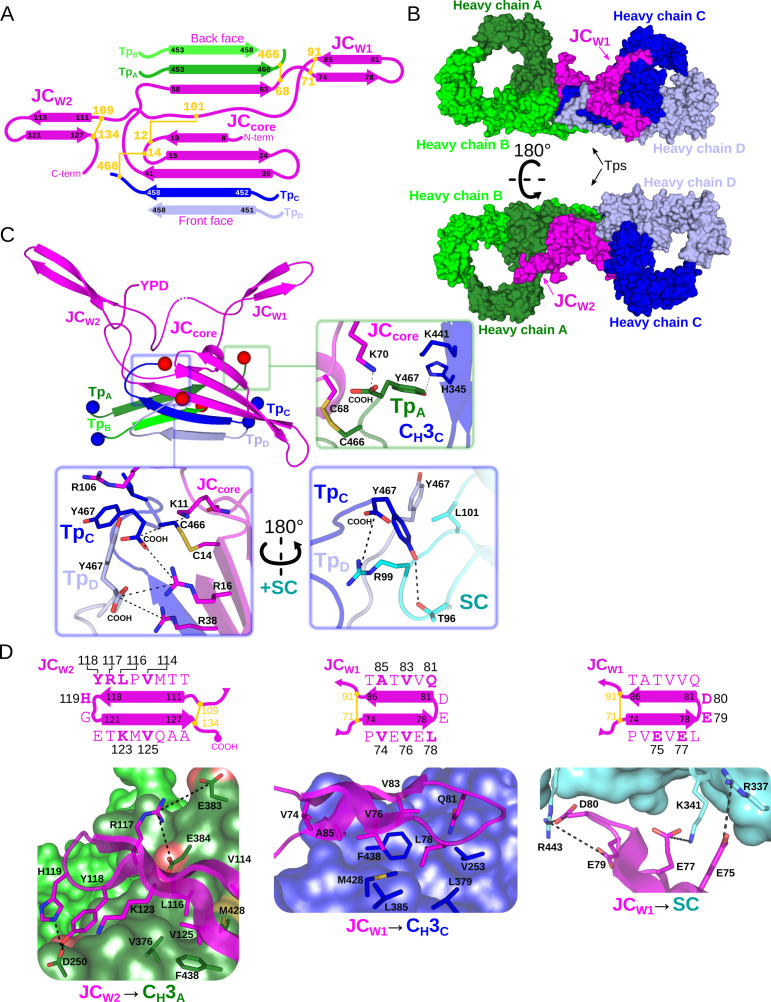
Figure 3. Fc dimer interface and JC structure.
(A) Schematic depicting the topology that arises from JC and its interactions with four Tps and colored as in Figure 2. JC regions (JCW1, JCW2, JCcore, and N- and C termini) are labeled along with TpA-D and their location relative to the front face or back face of SIgA; disulfide bonds are indicated in yellow and the residue boundaries of each β-strand are labeled. (B) SIgA molecular surface representation (SC removed) colored as in Figure 2 and indicating the location of JCW1, JCW2 and Tps relative to each HCA-D in two SIgA orientations. (C) Cartoon representation of JC and Tps complex (same region as shown in panel A) with the N- and C termini of each Tp shown as blue and red spheres, respectively. Regions surrounding the three C-terminal residues of Tp are boxed, TpA (green box), and TpC and TpD (blue boxes), and enlarged. Enlargements show Tp carboxy termini (COOH) and side chain sticks involved in interactions with adjacent Tps, JC, CH3 domains, and SC. The three C-terminal residues of TpB are disordered and not shown. (D) Topology diagram and sequence (top) and structure (bottom) detailing interactions between JCW2 and CH3A (left), JCW1 and CH3C (center), and JCW1 and SC (right) and colored as in A-C. JC residues interacting with CH3 or SC are indicated in bold and numbered in the topology diagram (top) and shown as sticks on a cartoon representation (bottom); CH3 and SC domains are shown as molecular surface representations with interfacing residues shown as sticks. Negatively charged atoms in CH3 that form contacts are shown as a red surface.

