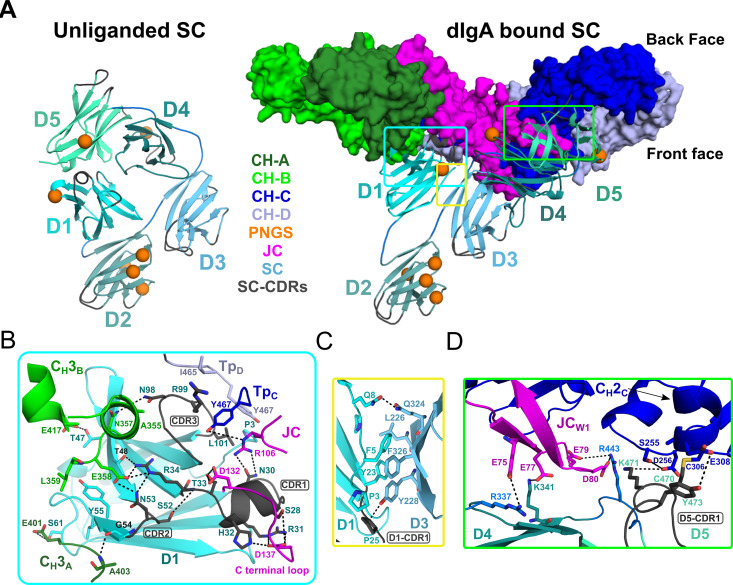
Figure 4. SC Structure.
(A) Cartoon representations of an unliganded mouse SC homology model based on unliganded human SC crystal structure (PDB code 5D4K; left) and the dIgA-bound mouse SC (right). The dIgA is shown as a molecular surface representation; SC domains D1-D5 are show in color gradient from cyan (D1) to pale green (D5), with CDR loops colored gray; PNGS are shown as orange spheres. Regions where SC interfaces with dIgA and other SC domains are boxed. (B-D) Boxed, enlarged views of stabilizing interfaces between SC Fc, JC and other SC domains; colored as in panel A. (B) SC D1 interface with CH3A, CH3B, TpC, TpD. (C) SC D1-D3 interface. (D) SC D4-D5 interface with JC and CH2C. In all panels conserved, interfacing residues are shown as sticks and hydrogen bonds and salt bridges are show as black dashes.

