. 2020 Oct 27;9:e56098. doi: 10.7554/eLife.56098

Figure 6. Modeling of Fabs and CDRs on SIgA.

(A) SIgA structure shown with four Fabs, each modeled in a single position as well as all possible positions and shown in multiple orientations. Complex components are colored according to the key (center). (B) The number of positions sampled by Fab CDRs were quantified by measuring the angle (ϕ) between the Fab vector and the y-axis, a vector parallel to the FcAB plane and passing through the center of mass of Fc and JC. The frequency (normalized count) of each angle is shown as a histogram.

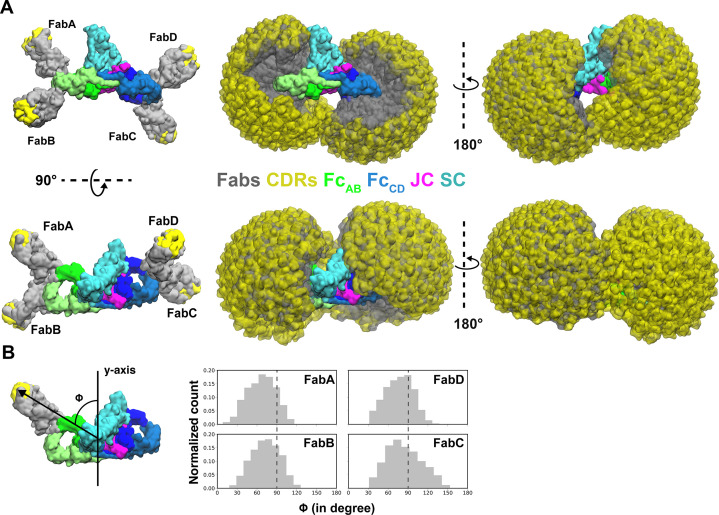
Figure 6.

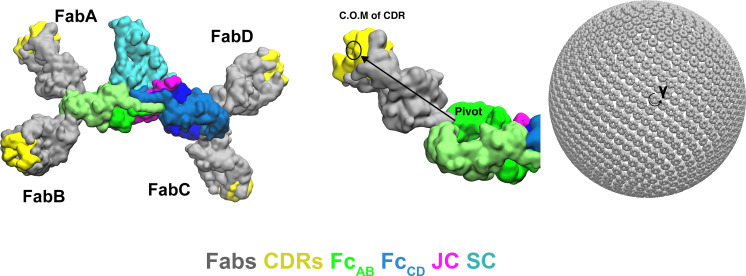
Figure 6—figure supplement 1. Modeling strategy for the computational search of SIgA Fab positions.

Figure 6—figure supplement 1.

(Left) SIgA structure shown with four modeled Fabs in one orientation. (Right) Schematic showing how Fab positions were modeled by mapping a vector, spanning from the N-terminal residue in the CH2 domain (pivot) to the center of mass (C.O.M) of the CDRs (yellow), onto a Fibonacci spherical lattice (FSL) with one thousand points and γ angle intervals of 45°.