. 2020 Nov 18;9:e63042. doi: 10.7554/eLife.63042

Figure 3. DHX34 induces large conformational changes in RUVBL2.

(A) Side and bottom views of the RUVBL1-RUVBL2 ring obtained after refinement without the influence of DHX34 and the OB-fold domains. Squares highlight N-terminal segments of RUVBL1 (blue) and RUVBL2 (pink). Scale bar represents 25 Å. The presence and absence of RUVBL1 and RUVBL2 N-terminal regions is indicated only in one copy of each subunit, but it applied to all the subunits in the complex. (B) Bottom view of the atomic structure of RUVBL1-RUVBL2 ring modeled from the cryo-EM density. Color codes are as in (A). (C) Right panel: a view of the nucleotide binding region in RUVBL2 from the crystal structure of RUVBL1-RUVBL2 (PDB 2SXZ) in gray color; left panel: similar view of RUVBL2 in RUVBL1-RUVBL2 after DHX34 binding (this work, pink). (D) Close-up view of the nucleotide-binding regions in RUVBL1, comparing the structure after DHX34 binding (left panel) and the crystal structure of the RUVBL1-RUVBL2 complex (PDB 2SXZ) (right panel) in gray. N-terminal histidines (H18 and H20) are indicated in gray, Walker A residues in orange, Walker B in red, and the Arg finger in yellow. (E) As in (D) but for the RUVBL2 subunit. Color codes for relevant and catalytic motifs are represented as in (D).

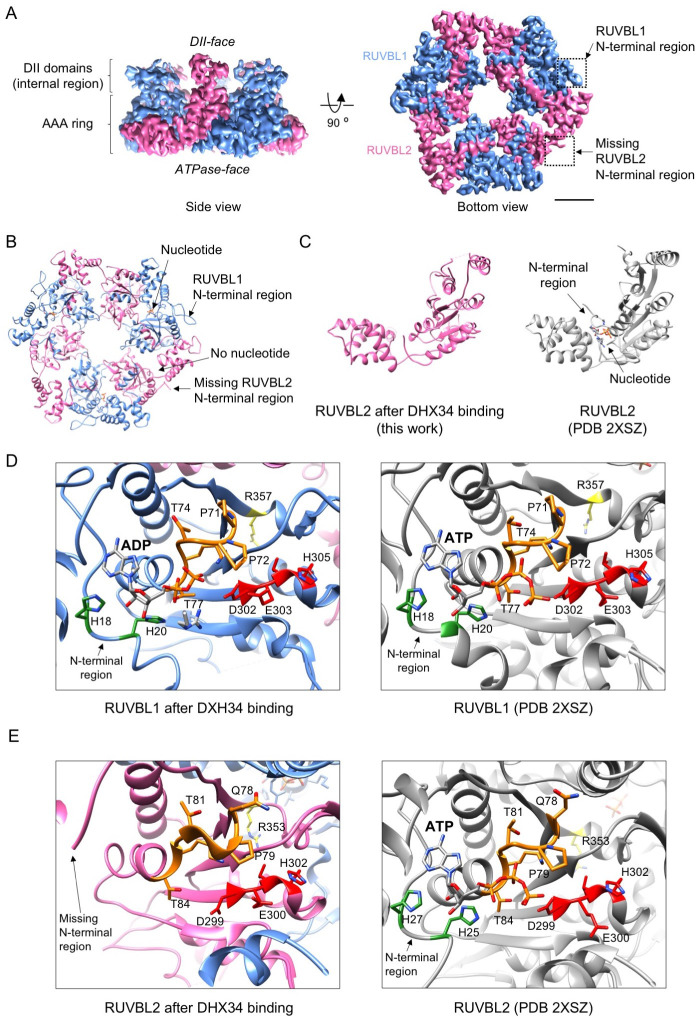
Figure 3.

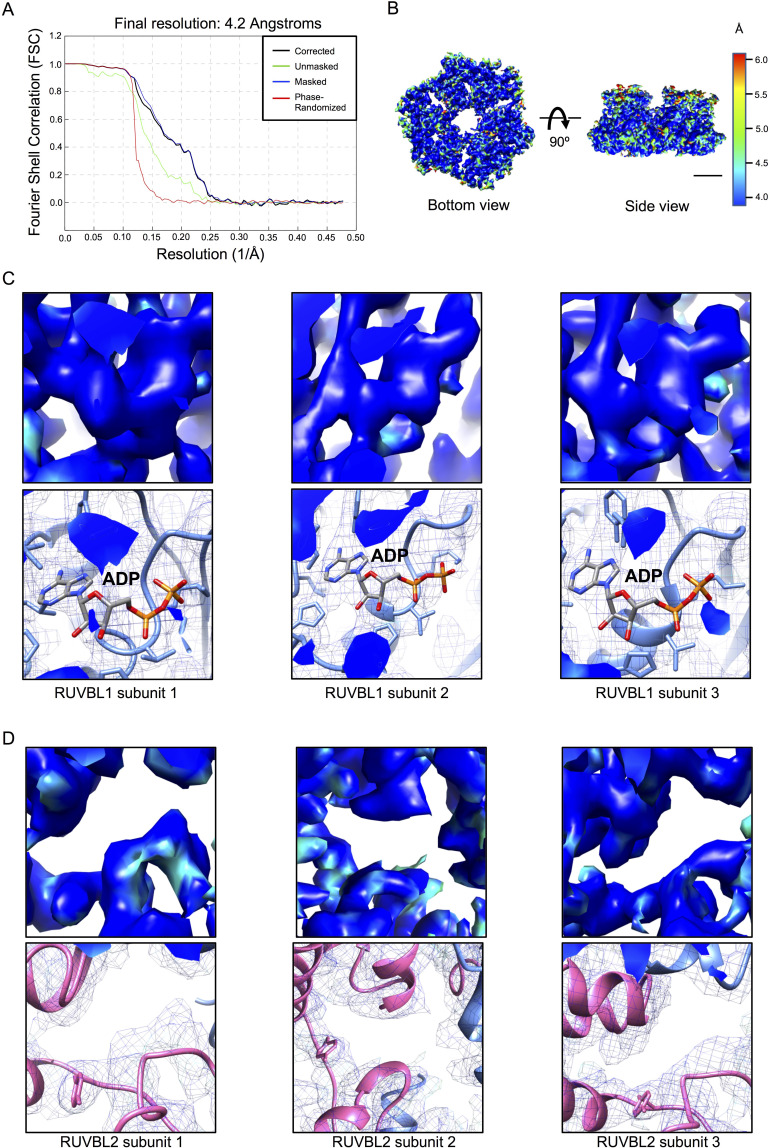
Figure 3—figure supplement 1. Resolution estimation of the cryo-EM for RUVBL1-RUVBL2 after DHX34 binding.

Figure 3—figure supplement 1.

(A) Fourier Shell Correlation (FSC) curves for the hexameric ring after refinement removing the influence of DHX34 and the OB-fold domains. (B) Local resolution estimates for the hexameric ring of RUVBL1-RUVBL2 as provided by RELION. Bottom and side views of the map are shown using the color scale shown on the right. Scale bar, 25 Å. (C) Close-up of the local resolution estimates centered in the nucleotide binding pockets of RUVBL1, showing all three subunits. Top panels show the density of the local resolution map using the same color code as in (B). Bottom panels show the same region but as a mesh with the atomic model fitted. (D) As ‘C’, but for each RUVBL2 subunit.
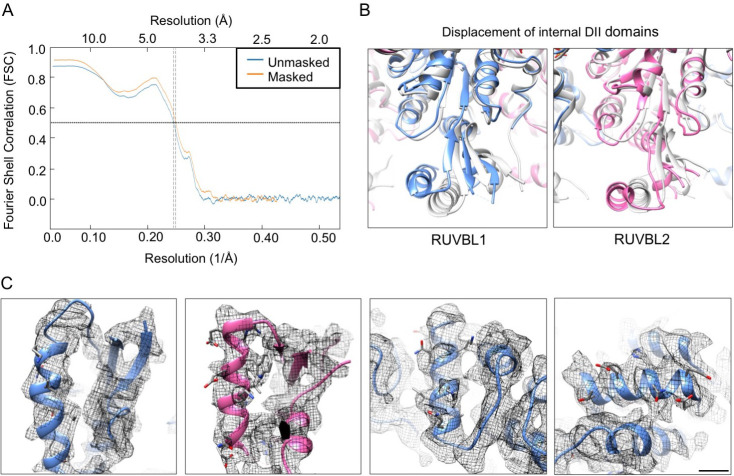
Figure 3—figure supplement 2. High-resolution features in cryo-EM map.

Figure 3—figure supplement 2.

(A) Fourier Shell Correlation (FSC) curves for the atomic model versus the cryo-EM density of the RUVBL1-RUVBL2 ATPase core using for modeling. (B) Close-up views of RUVBL1 (left) and RUVBL2 (right) internal DII domains superimposed with the structure of unliganded RUVBL1-RUVBL2 (PDB 2SXZ) in gray color. (C) Selected areas showing high-resolution features with side chain of some residues shown. Scale bar, 5 Å.
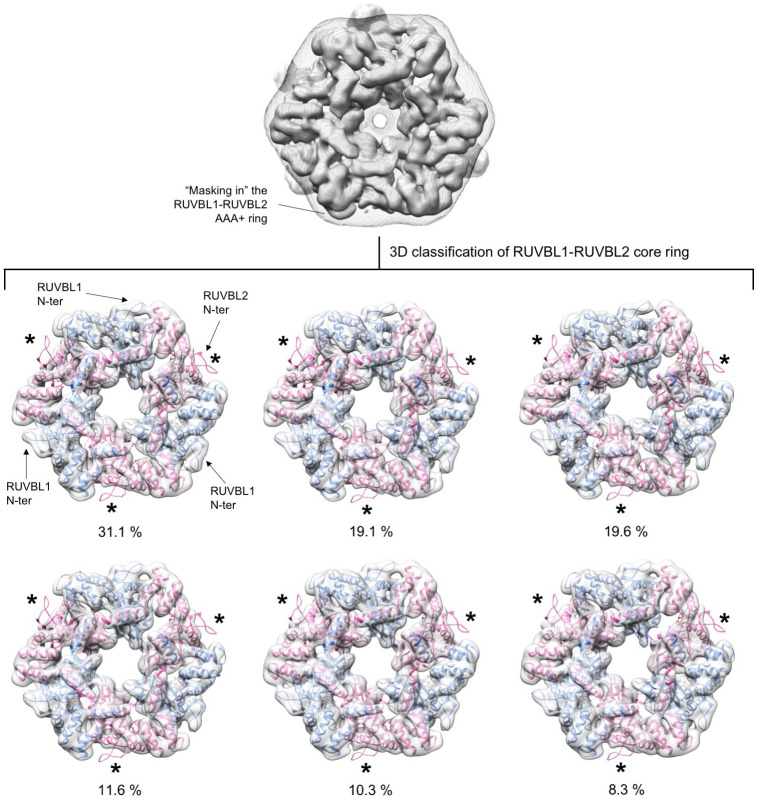
Figure 3—figure supplement 3. Analysis of conformational changes in each RUVBL2 subunit.

Figure 3—figure supplement 3.

Experiment 1. RUVBL1-RUVBL2-DHX34 particles were classified in six groups with a mask that removed the influence of DHX34 and the flexible DII domains from the analysis. Each sub-group was analyzed by fitting the atomic structure of the RUVBL1-RUVBL2 core domains (PDB 2XSZ). Cryo-EM density for RUVBL1-RUVBL2 is shown as a white transparency, RUVBL1 is shown in blue color and RUVBL2 in pink color. The percentage of particles in each subgroup is indicated. All groups showed density for the N-termini of RUVBL1. The N-termini of RUVBL2 present in the crystal structure is not present in the cryo-EM density of any subunit in any of the groups. The positions of the N-termini of RUVBL2 are indicated with asterisks.
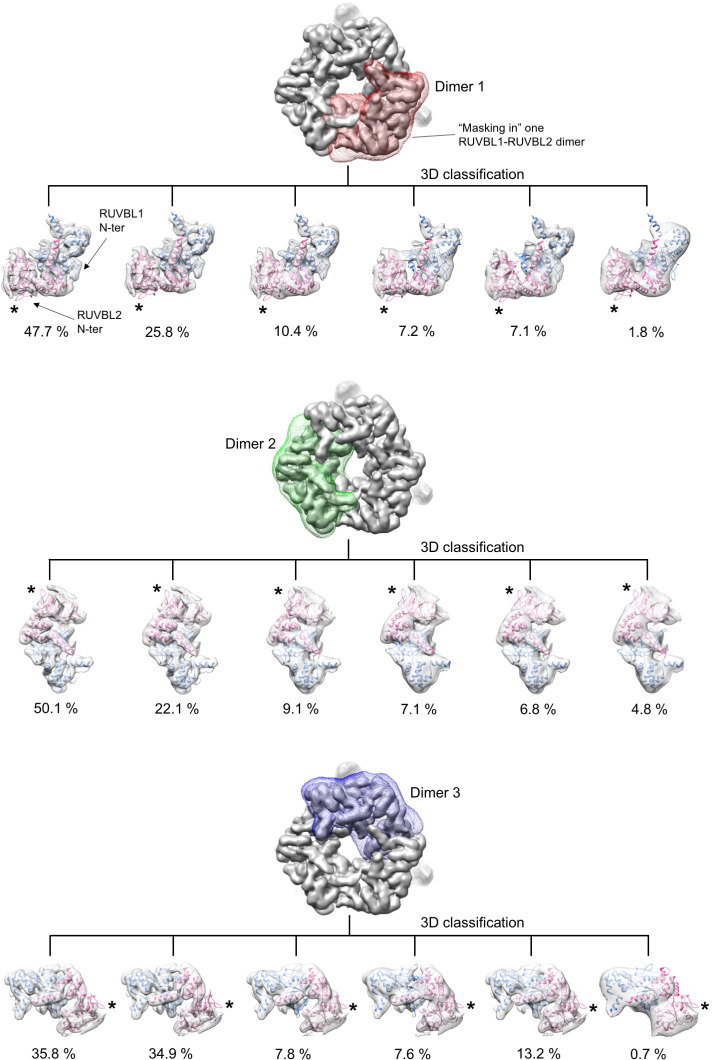
Figure 3—figure supplement 4. Analysis of conformational changes in each RUVBL2 subunit.

Figure 3—figure supplement 4.

Experiment 2. RUVBL1-RUVBL2-DHX34 particles were classified in six groups with a mask centered in only one RUVBL1-RUVBL2 dimer at a time. Each sub-group was analyzed by fitting the atomic structure of the RUVBL1-RUVBL2 core domains (PDB 2XSZ). Cryo-EM density for RUVBL1-RUVBL2 is shown as a white transparency, RUVBL1 is shown in blue color and RUVBL2 in pink color. The percentage of particles in each subgroup is indicated. All groups showed density for the N-termini of RUVBL1. The N-termini of RUVBL2 present in the crystal structure is not present in the cryo-EM density of any subunit in any of the groups. The positions of the N-termini of RUVBL2 are indicated with asterisks.
Figure 3—figure supplement 5. Analysis of conformational changes in each RUVBL2 subunit.

Figure 3—figure supplement 5.

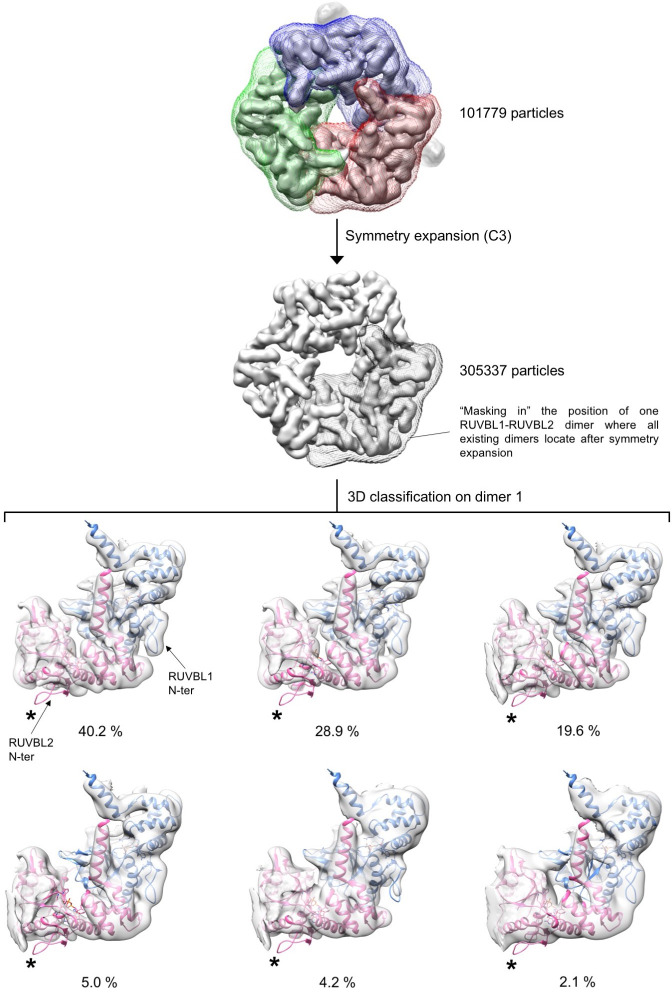
Experiment 3. The conformation of each RUVBL1-RUVBL2 dimer was analyzed using a symmetry expansion strategy. Each particle was rotated twice along its longitudinal axis so that each of the three RUVBL1-RUVBL2 dimers in each particle locates in the same position. After the expansion the data set is triplicated. Then, particles were locally classified in six groups using a mask focused in only one dimer. Each sub-group was analyzed by fitting the atomic structure of the RUVBL1-RUVBL2 core domains (PDB 2XSZ). Cryo-EM density for RUVBL1-RUVBL2 is shown as a white transparency, RUVBL1 is shown in blue color and RUVBL2 in pink color. The percentage of particles in each subgroup is indicated. All groups showed density for the N-termini of RUVBL1. The N-termini of RUVBL2 present in the crystal structure is not present in the cryo-EM density of any subunit in any of the groups. The positions of the N-termini of RUVBL2 are indicated with asterisks. A small percentage of particles (2.1%) showed a partial loss of density for RUVBL2 N-termini, which can be due in most part to the lower resolution of this subset.