. 2020 Dec 1;9:e61235. doi: 10.7554/eLife.61235

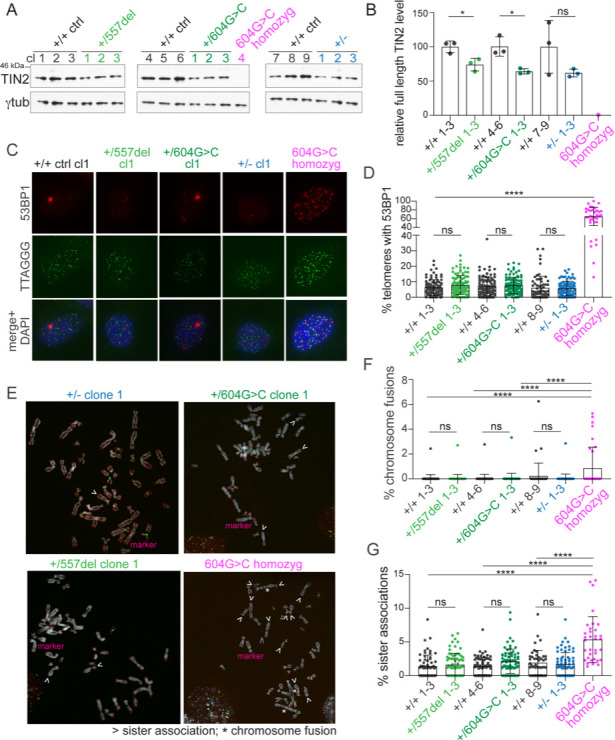
Figure 4. Heterozygous TINF2 mutations do not cause telomere damage or genome instability.

(A) Immunoblot for TIN2 and γtubulin in control cells and the indicated clones with targeted TINF2 alleles. (B) Quantification of the immunoblot shown in A. Unpaired t-test was used to determine significance. Symbols: *p<0.05; ns, not significant (0.16). (C) Representative images of TIF analysis in control and indicated TINF2 mutant cells. IF for 53BP1 (red), telomeric FISH (green) and DNA (DAPI, blue). (D) Quantification of percentage of telomeres colocalizing with 53BP1 foci. Data from ≥50 nuclei per cell line, with three cell lines per genotype (with the exception of the single c.604G > C homozyg clone). (E) Representative metaphase spreads of cells with mutated TINF2 alleles. Sister telomere associations (>), telomere fusions (*), and a marker chromosome found in all clones (marker) are indicated. Telomere FISH (red), centromere FISH (green) and DNA (DAPI, gray). (F) Quantification of telomere fusions ≥20 spreads per cell line, with three cell lines per genotype (except for the single 604G > C homozyg clone). (G) Quantification of the % of telomeres found in sister associations. Data from ≥20 spreads per cell line; three cell lines per condition, except for the single 604G > C homozyg clone. For the quantification in (B), (D), (F), and (G) means ± SD and individual data points are shown. One-way ANOVA with Tukey post-test was used to determine significance, p-values: ****p<0.0001, ***p<0.001, **p<0.01, *p<0.05. ns, not significant. See also Figure 4—figure supplements 16.

Figure 4.

Figure 4—figure supplement 1. Transcript analysis in 604G > C/+ cells reveals presence of two alternative TINF2 transcripts (604G > C I, 604G > C II).
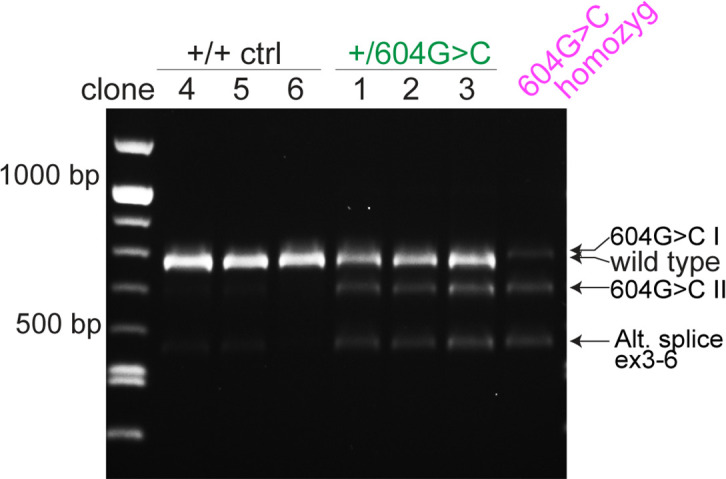
Figure 4—figure supplement 1.

Transcript analysis in control cells and cells with c.604G > C TINF2 mutations. Wild-type and alternative (604G > C I, 604G > C II, alt. splice exons 3–6) transcripts are indicated. Alt. splice exons 3–6 is present in controls and mutant cells.
Figure 4—figure supplement 2. Knock-in strategy for introduction of c.557del and c.604G > C mutations into RPE1 cells.
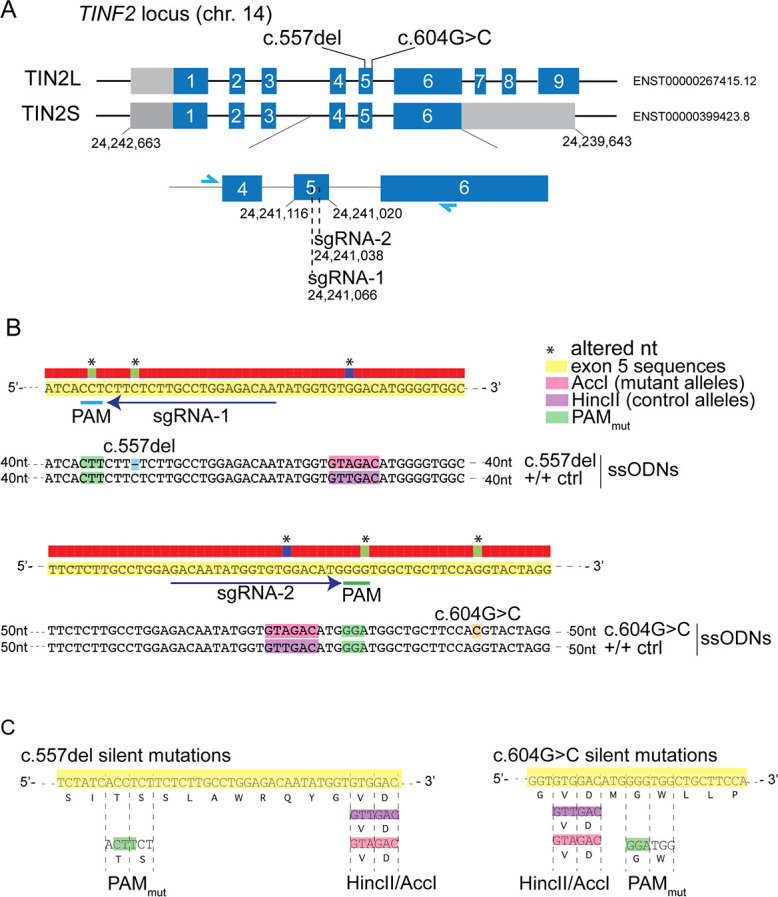
Figure 4—figure supplement 2.

(A) Schematic of the TINF2 locus showing landmarks relevant to CRISPR/Cas9-mediated knock-in of TINF2 mutations. The single guide RNA (sgRNA) target regions and the primers used for genotyping (blue arrows) are indicated. (B) Schematic showing the reference sequence (yellow), the PAM (green), sgRNA sequences, and mutant and control (with silent mutations) repair templates that were co-transfected with the sgRNA/Cas9 vector. The upper panel shows the repair template used to introduce c.557del mutations and the lower panel the template used for c.604G > C. Repair templates were designed to introduce the respective mutations, mutate the PAM sequence (green) and introduce restriction sites for screening (pink and purple). (C) Schematic showing that the introduced PAM mutations and added restriction sites do not change the amino acid sequence.
Figure 4—figure supplement 3. Strategy to generate TIN2+/- RPE1 clones.
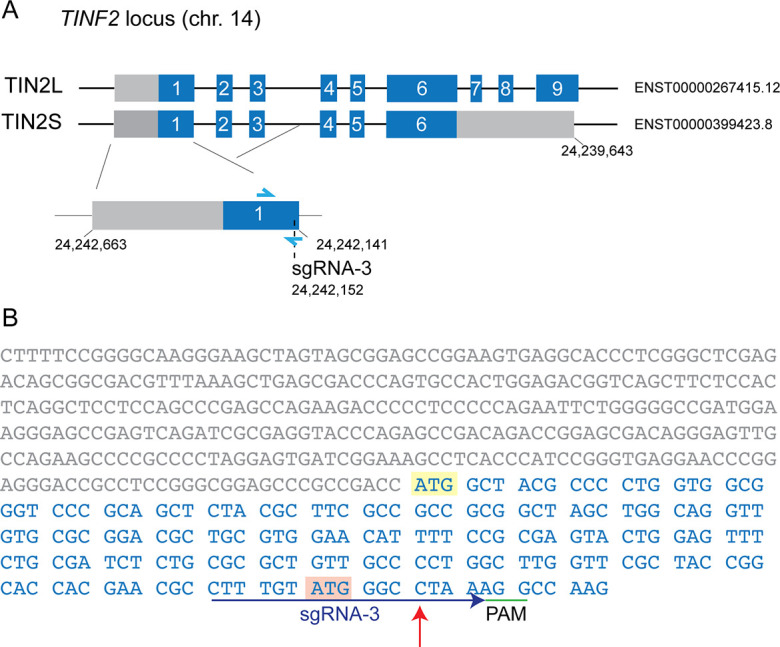
Figure 4—figure supplement 3.

(A) Schematic of the TINF2 locus showing landmarks relevant to CRISPR/Cas9-mediated targeting of exon1. The single guide RNA (sgRNA) target region and the primers used for genotyping (blue arrows) are indicated. (B) Sequence of TINF2 exon 1 with the 5′ UTR (gray) and coding region (blue). The PAM (green) and sgRNA sequence (blue) is indicated.
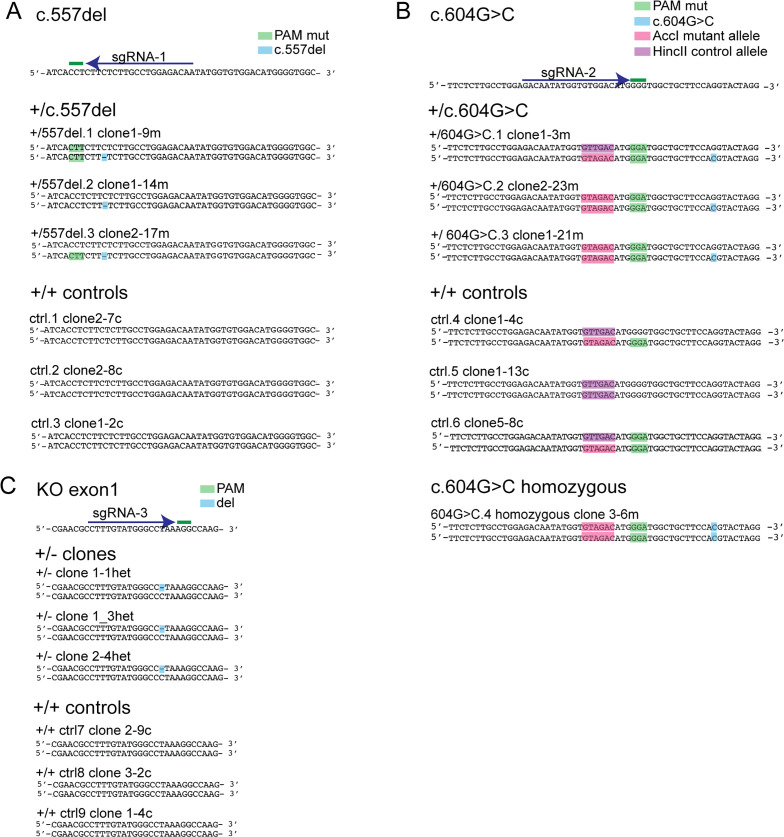
Figure 4—figure supplement 4. Sanger sequencing of CRISPR/Cas9-engineered clones with TINF2 mutations.

Figure 4—figure supplement 4.

(A–C) Reference sequence with sgRNA sequence and PAM and the edited sequences (highlighted) of the obtained cell lines for c.557del (A), c.604G > C (B) and TIN2+/- cells (C) and control cell lines.
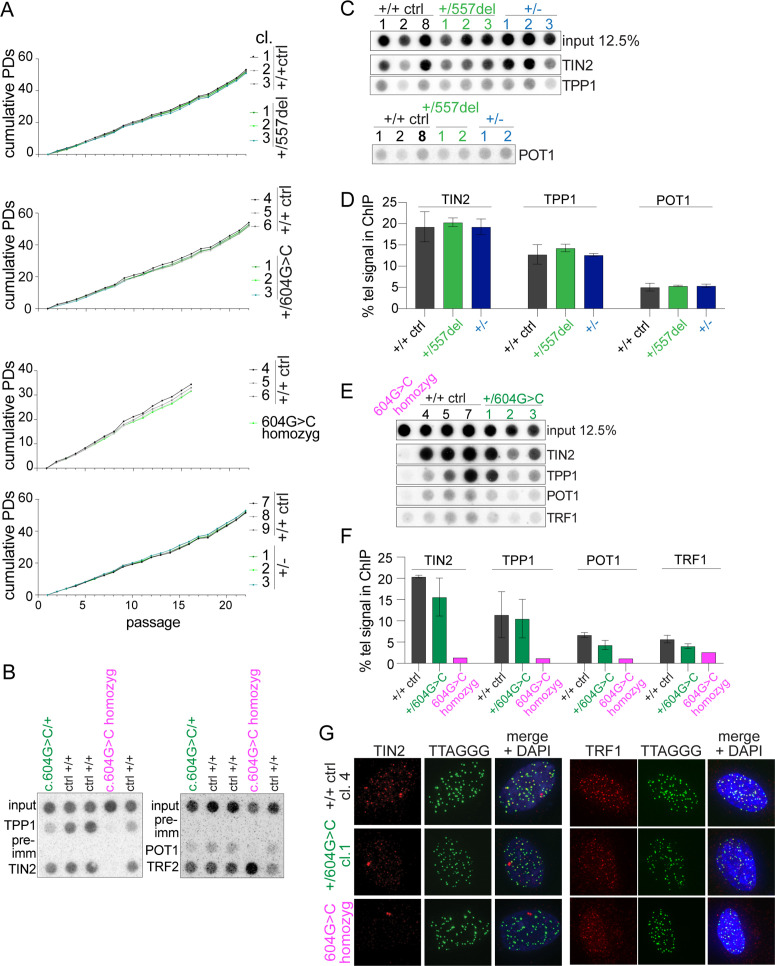
Figure 4—figure supplement 5. Characterization of cells with targeted TINF2 alleles.

Figure 4—figure supplement 5.

(A) Growth curves of RPE1 control cells and cells with heterozygous c.557del or c.604G > C, homozygous c.604G > C mutations, or TIN2+/- cells. (B) Telomeric ChIP to determine the specificity of Abs for TIN2, TPP1, and POT1 compared to pre-immune serum (pre-imm). Cell lines used are indicated above the rows. (C) Telomeric ChIP analysis with TIN2, TPP1, or POT Ab in control, c.557del mutant and TIN2+/- cells. All samples were processed in parallel. The input shown is the same for the TIN2, TPP1, and POT1. (D) Quantification of telomeric DNA recovered with the respective Abs (mean ± SD, % telomeric DNA recovered in three clones per genotype for TIN2 and TPP1, and two clones for POT1). (E) Telomeric ChIP analysis with TIN2, TPP1, TRF1, and POT1 Ab in control and heterozygous and homozygous c.604G > C clones. (F) Quantification of telomeric DNA recovered with the indicated Abs as in (D) (mean ± SD, % telomeric DNA recovered in three independent clones for control and heterozygous c.604G > C). (G) IF-FISH for TIN2, TRF1, or TRF2 (red) and telomeres (green) in control cells and cells with heterozygous and homozygous c.604G > C mutations.
Figure 4—figure supplement 6. Representation of TIFs, telomere fusions, and sister associations in the individual cell lines.
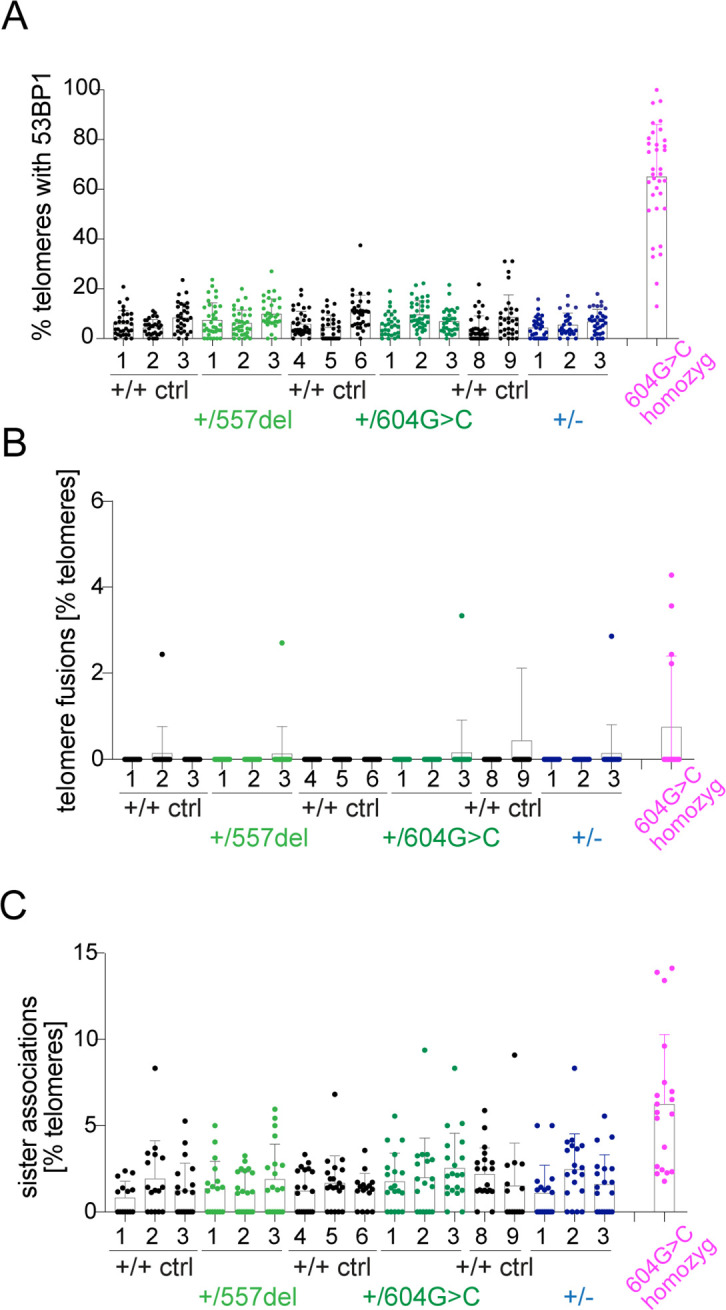
Figure 4—figure supplement 6.

(A) Quantification of telomeres containing 53BP1 (≥50 nuclei per cell line, with individual cell lines from Figure 4D shown). (B) Quantification of telomere fusions (≥20 spreads per cell line, with individual cell lines from Figure 4F shown). (C) Quantification of sister associations (≥20 spreads per cell line, with individual cell lines from Figure 4G shown).