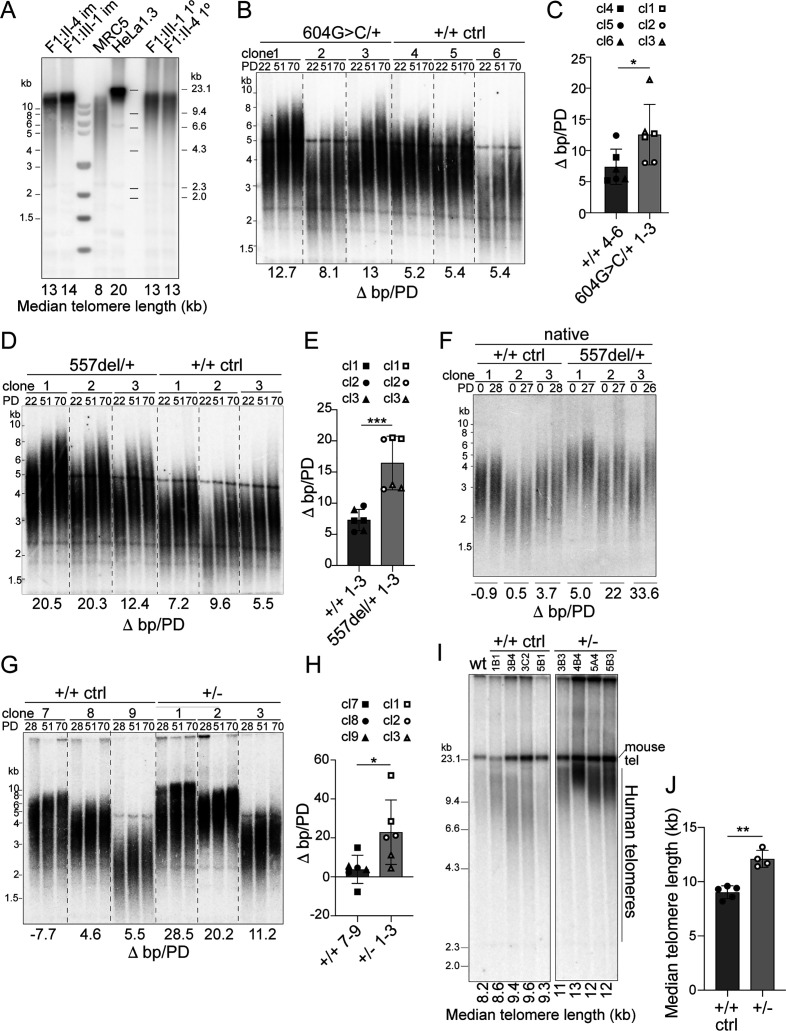
Figure 5. Heterozygous TINF2 mutations induce telomere lengthening.
(A) Telomeric Southern blot of MboI/AluI-digested genomic DNA from immortalized and primary patient cells (lymphocytes), normal lung fibroblasts (MRC5), and HeLa1.3 cells. Median telomere length (MTL) is indicated. (B) Telomeric Southern blot of MboI/AluI-digested genomic DNA from control clones and clones with heterozygous c.604G > C mutations at the indicated PDs. Telomere length changes are indicated and were calculated over 48 PDs. (C) Quantification of median telomere length changes for control cells and cells with heterozygous c.604G > C mutations. Three cell lines per genotype were analyzed in two independent experiments (symbols denote the individual cell lines). (D) Telomeric Southern blot as in (B) for control clones and clones with heterozygous c.557del mutations. (E) Quantification of median telomere length changes for control cells and cells with heterozygous c.557del mutations as in (C). (F) Detection of telomeres in MboI/AluI-digested genomic DNA from control clones and clones with heterozygous c.557del mutation probed under native conditions with a telomeric probe for the 3’ overhang. The change in MTL over 28 PDs is indicated. (G) Telomeric southern blot as in (B) for control cells and TIN2+/- cells. The indicated telomere length changes were calculated over 42 PDs. (H) Quantification of median telomere length changes for control cells and TIN2+/- cells as in C. (I) Telomeric southern blot of MboI/AluI-digested genomic DNA from control and TIN2+/- hESCs. All clones were generated and propagated in parallel and telomere length was determined at 28 days after the CRISPR/Cas9 targeting. (J) Quantification of the median telomere length (as determined by blotting as in (I)) for control and heterozygous hESCs clones (control, n = 5; TIN2+/KO, n = 4). Bar graphs in (C), (E), (H), and (J) show means ± SDs. P-values are based on unpaired t-test. ****p<0.0001, ***p<0.001, **p<0.01, *p<0.05. ns, not significant. See also Figure 5—figure supplements 1–3.
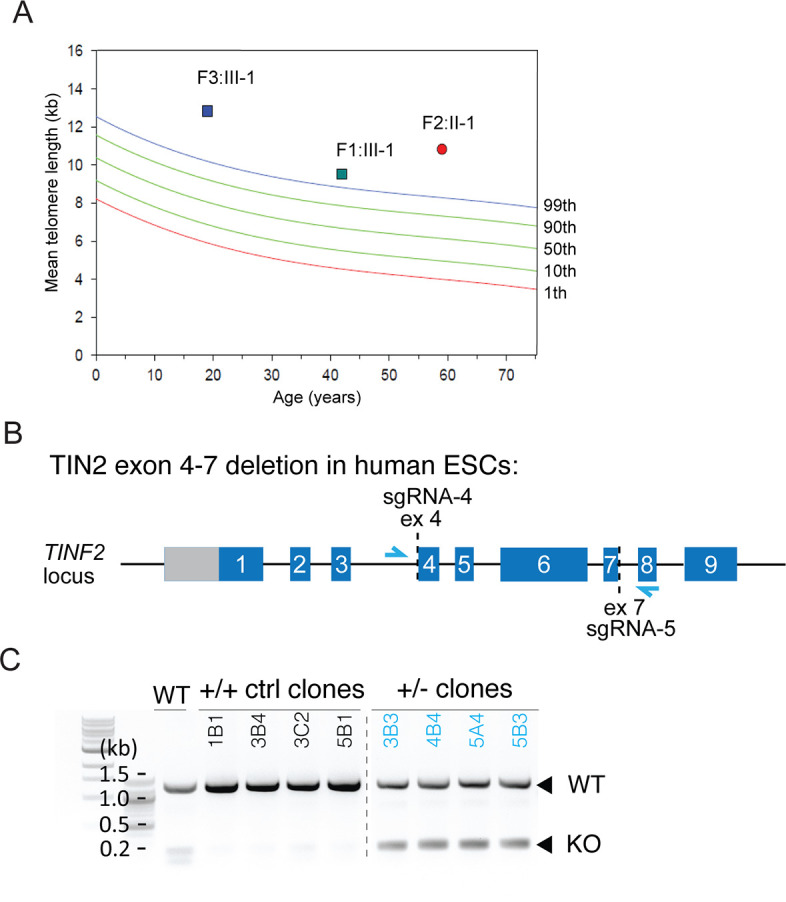
Figure 5—figure supplement 1. Long telomeres in TINF2 c.604G > C and c.557del patients and hESC CRISPR/Cas9 editing.

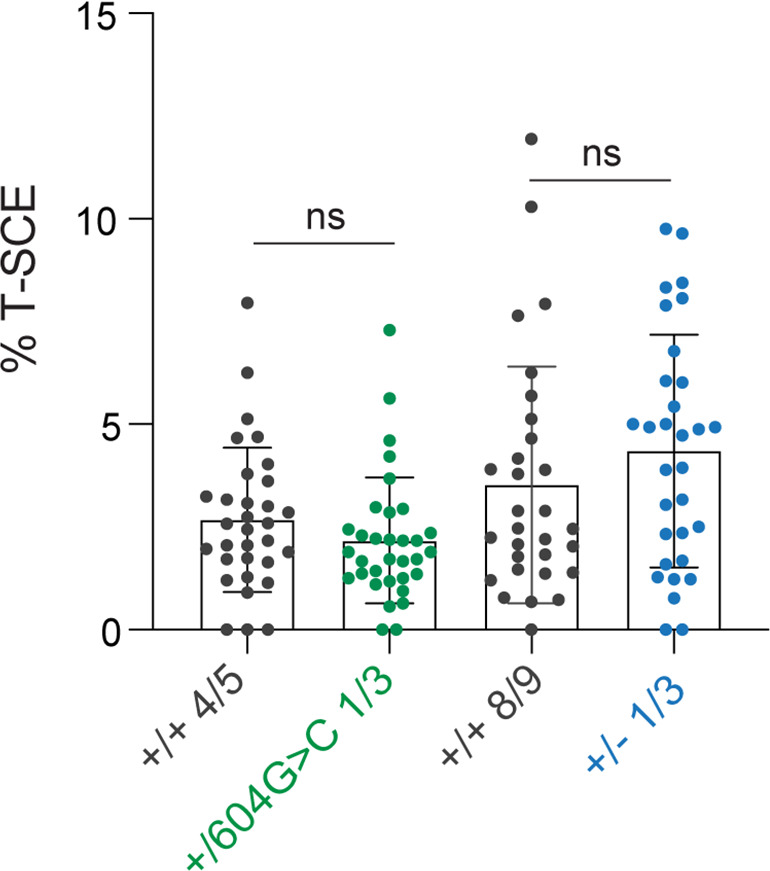
Figure 5—figure supplement 2. No evidence for increased telomere recombination in c.604G > C mutant and Tin2+/- cells.

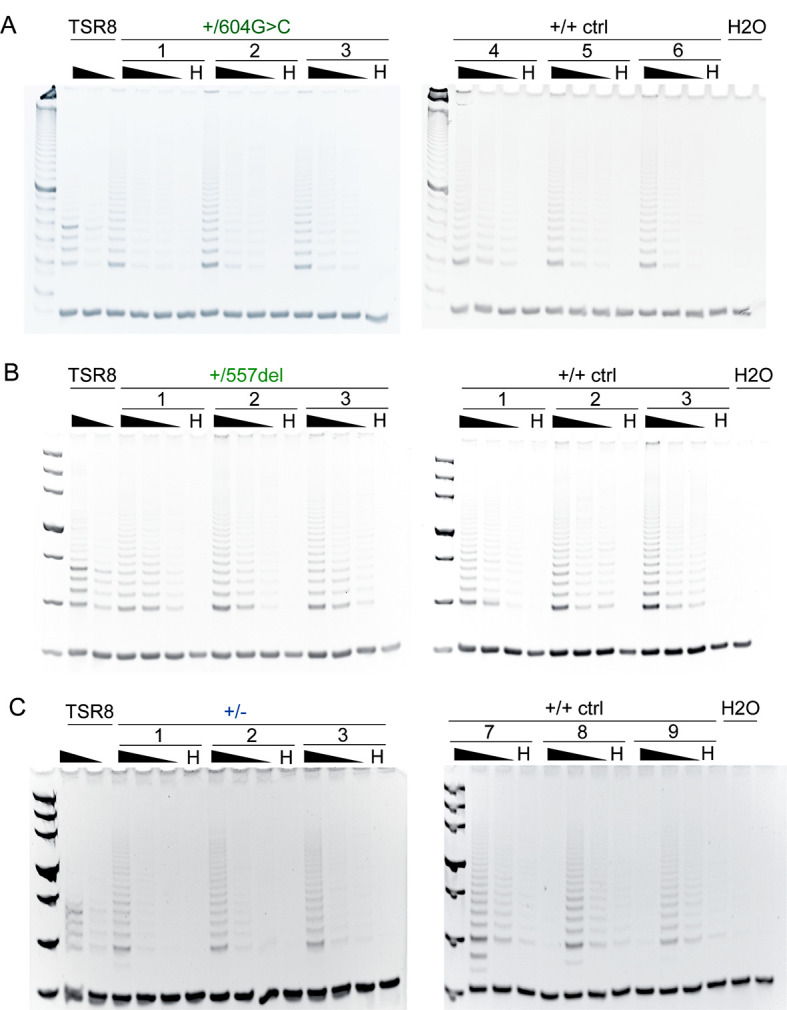
Figure 5—figure supplement 3. Mutant and control RPE1 clones show similar telomerase activity.


