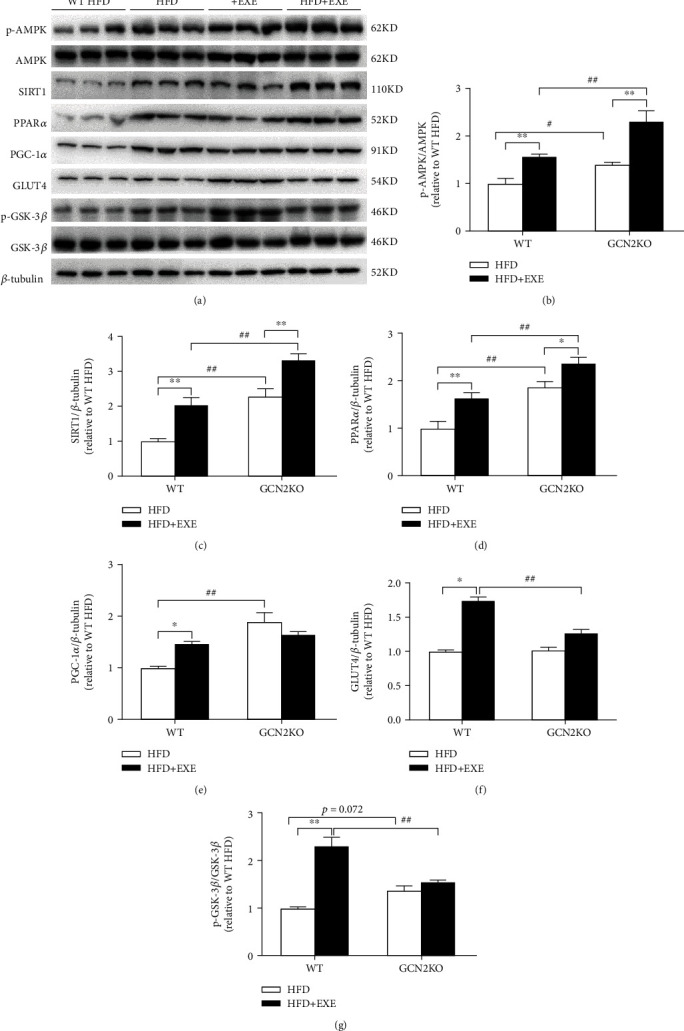
Figure 3.

Expression level of proteins involving in the glucolipid metabolic signaling pathway in the liver of mice: (a) representative immunoblot; (b–g) the expression levels of (b) p-AMPK, (c) SIRT1, (d) PPARα, (e) PGC-1α, (f) GLUT4, and (g) p-GSK-3β proteins. Data are means ± SEM (n = 6). ∗p < 0.05 and ∗∗p < 0.01 for the difference between sedentary and exercise regimes, as determined by two-way ANOVA and Tukey post hoc test. #p < 0.05 and ##p < 0.01 for the difference between WT and GCN2KO groups, as determined by two-way ANOVA and Tukey post hoc test.
