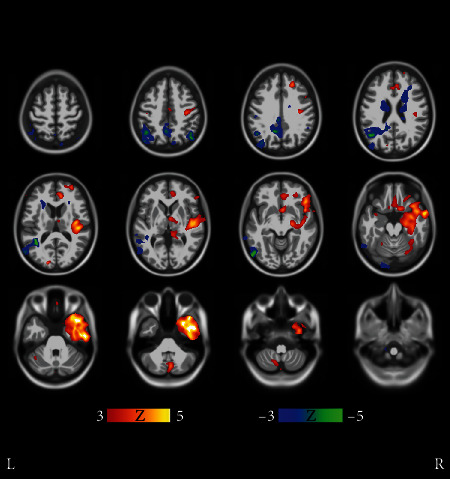
Figure 6.

Results of voxel-wise t-tests of gray matter distributions between clusters 6 and 7 in Figure 1. Clusters 6 and 7 very closely resemble each other. Voxel-wise t-tests do not show significant regional differences in atrophy patterns of clusters 6 and 7 except retroorbitally on the right hemisphere, where cluster 7 subjects display more atrophy. Due to scattered and anatomically confined bidirectional differences, the clusters are interpreted to consist mostly of subjects having a similar atypical subtype of AD. Coronal and sagittal views are shown in Supplementary Results (Figures 4 b and 4 c). The FDR value is 0.0345.
