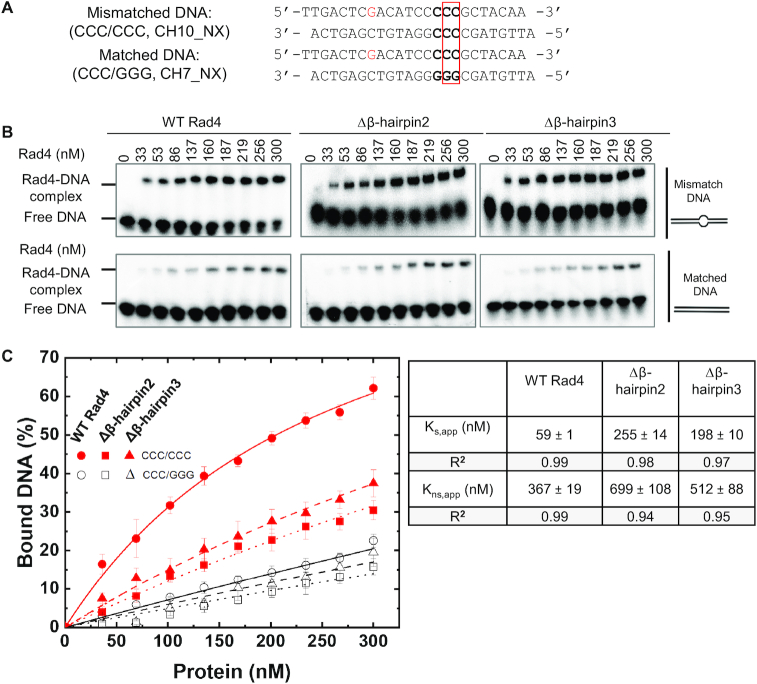
Figure 1.
Characterization of DNA binding affinities by Rad4–Rad23 complexes. (A) Sequences of DNA constructs used for the competitive EMSA. The position of the two flipped-out nucleotide pairs in the ‘open’ conformation is indicated with a red box. (B) Typical gel images showing the various Rad4 constructs binding to the mismatched CCC/CCC (top) and matched CCC/GGG DNA (bottom). (C) Quantification of the percent bound DNA fractions in (B) versus protein concentrations. The symbols and error bars indicate the means and ranges as calculated by ± sample standard deviation, respectively, from triplicate gel shift experiments. Filled red symbols indicate mismatched DNA and empty black ones indicate matched DNA; circle, square and triangle indicate WT, Δβ-hairpin2 and 3, respectively. Lines indicate the fit curves of the data points. Apparent dissociation constants for specific binding to mismatched DNA (Ks,app) and nonspecific binding to matched DNA (Kns,app) are also shown.

