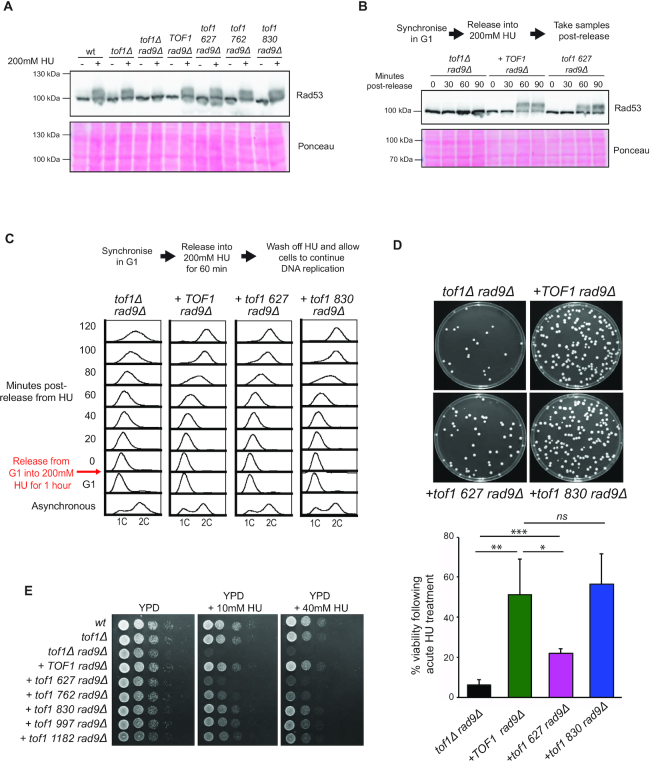
Figure 5.
Following HU arrest the N terminal half of Tof1 is sufficient for DRC activation and resumption of DNA synthesis but not cell viability in DDC deficient (rad9Δ) cells. (A) Rad53 activation assay following HU treatment. Activation of Rad53 causes autophosphorylation that results in reduced mobility of the Rad53 protein. The relative mobility of Rad53 in each of the indicated cell types either in exponentially growing cells or following a 2 h treatment with 200 mM HU was assayed by western blot using anti-Rad53 antibodies (top). Ponceau stained membrane of western blot shown in top panel indicates relative protein levels (bottom). Image shown is from one of two equivalent independently conducted experiments. (B) (Top) Time course of Rad53 activation following release from G1 into media containing 200 mM HU. (Bottom) Ponceau stained membrane of western blot shown in top panel indicates relative protein levels. Image shown is from one of two equivalent independently conducted experiments. (C) Recovery of DNA synthesis in cells following cell cycle arrest induced by 200 mM HU. The indicated cell mutants were arrested in 200 mM HU following release of a G1 synchronised culture. After 60 min in HU, the HU containing media was washed off and cells allowed to recover and resume passage through S phase. Shown are FACS profiles of DNA content before and after the HU arrest point. Time points indicate the time in minutes after release from the HU arrest (T0 indicates time from the first wash). Images of DNA content FACS shown are from one of two equivalent independently conducted experiments. (D) Viability of cells following cell cycle arrest induced by acute HU treatment. G1-arrested cells were released from the block into YPD media containing 200 mM HU for 60 min, after which the cultures were diluted and plated to YPD plates. Plates were incubated for 48 h at 25°C before images were taken (top). Colony number was counted 48 h after plating and results from 4 repeats were quantified and displayed in histogram (bottom). P values: * = <0.05, ** = <0.01, *** = <0.001 calculated using a two-tailed unpaired Student's t-test using four repeats for each mutant tested. (E) Viability of cells during chronic treatment with HU. Viability spot assay of TOF1, tof1Δ, tof1 627, tof1 762, tof1 830, tof1 997 and tof1 1182 cells on YPD or YPD plus 10 or 40 mM HU for three days at 25°C. Images shown are from one of two equivalent independently conducted experiments.

