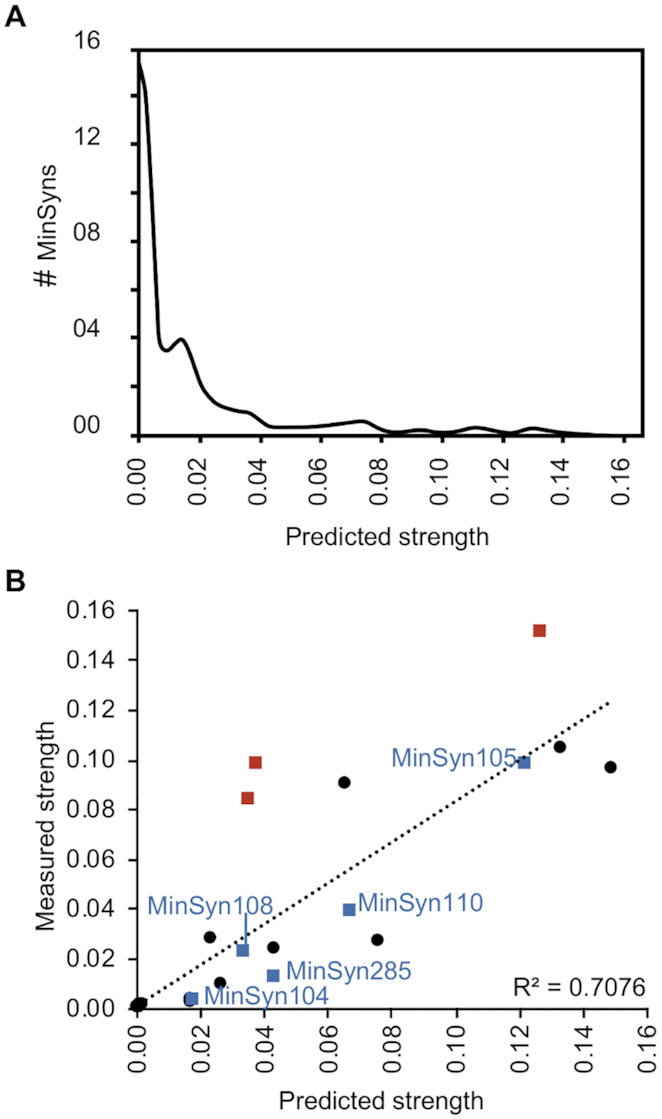
Figure 4.

Computational design of minimal synthetic promoters (MinSyns). (A) Of a population of 1000 MinSyns, the majority were predicted to have relatively weak expression (B) Comparison of predicted and measured strengths of 24 computational-designed MinSyns. Red squares indicate MinSyns with unintended CREs formed at sequence junction that may explain deviance from predicted strength. Blue squares indicate MinSyns selected for further characterization (Figure 5).
