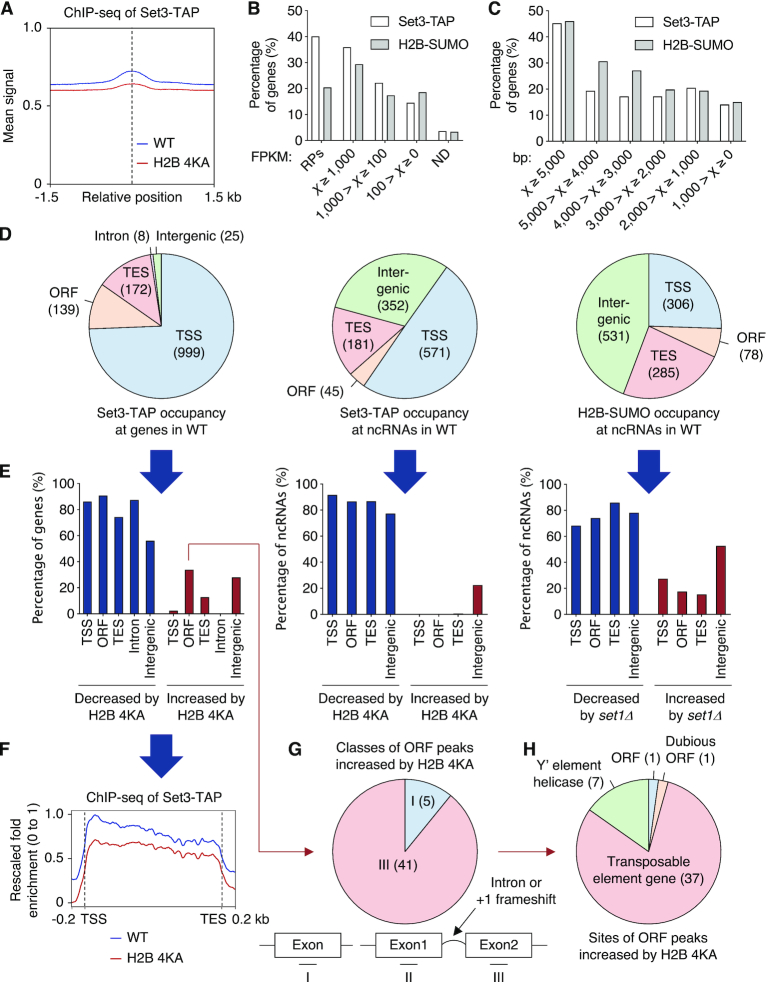
Figure 5.
Histone sumoylation governs association of SET3C with ncRNA genes. (A) ChIP reads-density plot for recruitment of Set3-TAP in WT and H2B-4KA strains, as shown in Figure 1I. (B and C) Percentage graphs of occupancy of Set3-TAP and post-translationally sumoylated histone H2B (H2B-SUMO) in WT cells with genes classified in (B) by FPKM (Fragments Per Kilobase of Million reads mapped) reported in our earlier RNA-seq experiments (50) and in (C) by gene length. RPs, ribosomal protein genes; ND, genes that were not detected. (D) Summary of genome-wide mapping of Set3-TAP at all genes (left) and at ncRNA loci (middle) and of H2B-SUMO at ncRNA loci (right) in WT. Pie graphs show the distribution of identified sites at the indicated regions. (E) Percentage graphs of data in (D) altered by H2B-4KA or set1Δ. Significantly decreased (blue) or increased (red) signals are shown. (F) Average plot of Set3-TAP recruitment at transcribed genes in WT and H2B-4KA cells. The y-axis values indicate fold-enrichment, setting the maximum occupancy to 1 and the minimum occupancy to 0; the x-axis represents normalized distance from TSS and TES. (G and H) Pie graphs showing percentage of ORF peaks of Set3-TAP increased by H2B-4KA in (E). ChIP-seq data were subdivided into three groups (G) single exon and two ‘exons’ separated by intron or +1 frameshift, or by description of genes (H). See also Supplementary Tables S1 (sheets 4–6) and S2.

