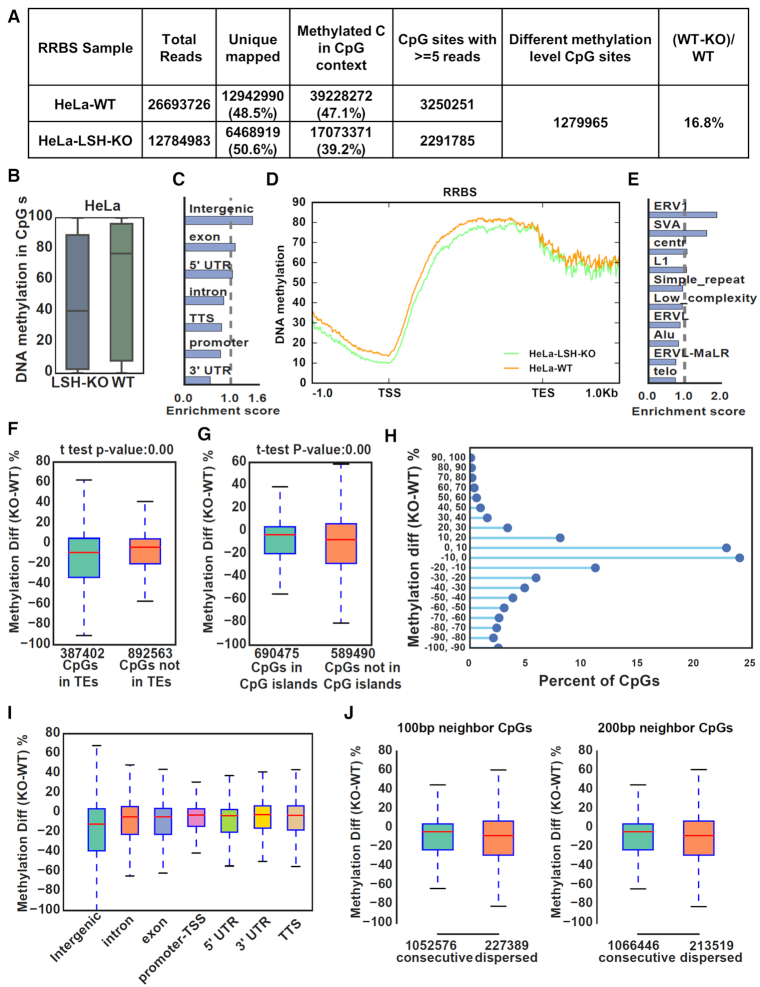
Figure 3.
Genome-wide DNA methylation analysis reveals a widespread role of LSH in DNA methylation. (A) Summary of RRBS data for control HeLa and LSH KO cells. Only uniquely mapped reads were kept and CpGs with ≥ 5 reads mapped were used for further analysis. (B) Global distribution and median levels of CpG methylation in control HeLa and LSH KO cells. (C) Genomic distribution of CpGs with highly reduced methylation in LSH-KO HeLa cells (WT-KO ≥ 30%, 276 513 CpGs). (D) Average CpG methylation levels for all genes and flanking 1kb regions in control HeLa and LSH-KO cells. TSS, transcription start site; TES, transcription end site. (E) Distribution of CpGs with highly reduced methylation (WT-KO ≥ 30%) that were mapped to transposable elements. (F) Comparison of methylation differences of CpG sites located within and not in transposable elements regions between control and LSH-KO cells. (G) Comparison of methylation differences of CpG sites in and not in CpG islands between control and LSH-KO cells. (H) All CpG sites were plotted according to the difference in levels of CpG methylation between control and LSH-KO cells. The Y axes represents distribution of CpG sites with DNA methylation in KO cells that were reduced from 0 to 100% or increased from 0 to 100% as compared to control. X axes represents the percentage of CpG sites in each category with a total of 100%. (I) CpG methylation changes between control and LSH-KO cells at different genomic regions. (J) CpG methylation changes at consecutive CpG sites and dispersed sites. Consecutive CpGs were defined as more than one CpG located in 100 bp (left) and 200 bp (right).

