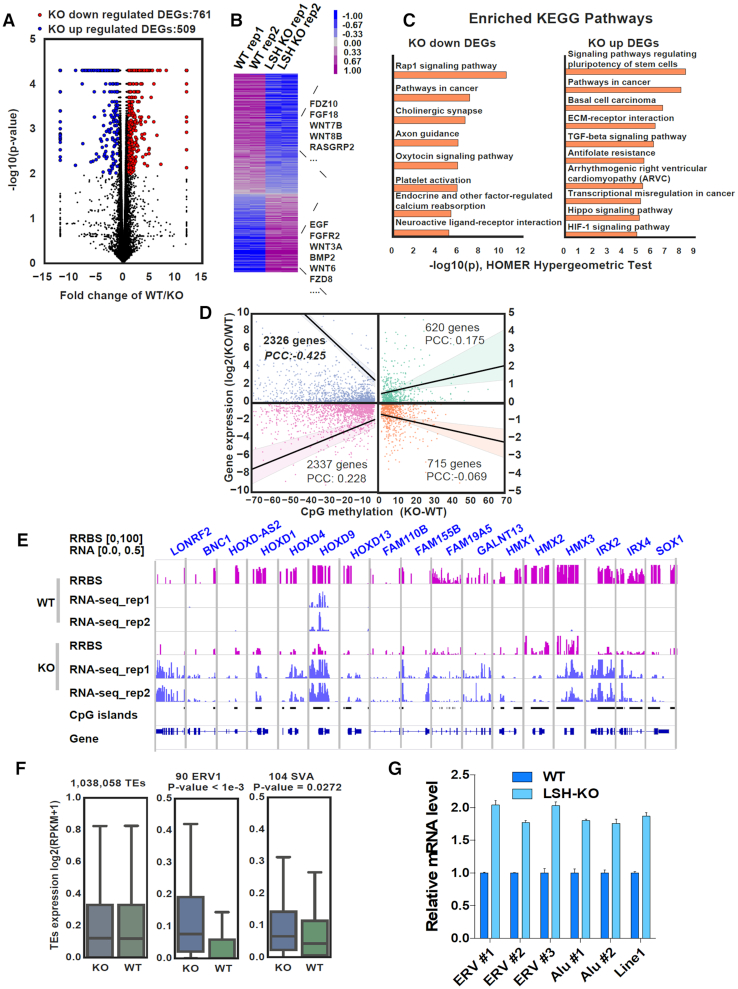
Figure 4.
Reduced promoter DNA methylation correlates with increased transcripts. (A) Volcano plot for differentially expressed genes between control and LSH KO HeLa cells. (B) Heatmap visualization of differentially expressed genes. (C) Enriched GO terms for the LSH-KO up- and down-regulated genes. (D) Correlation of DNA methylation changes at promoter and gene expression levels. Changes of DNA methylation represent the mean difference of CpGs in the TSS region. (E) Examples of genes with significantly decreased DNA methylation in CpG islands and up-regulated RNA transcripts in LSH-KO HeLa cells. (F) Expression changes at transposable regions for all TEs (left), ERV1 family (middle) and SVA family (right). Repeats of ERV1 and SVA families were selected as they had significant decrease of mean CpG methylations (KO-WT ≥ 30%). (G) qRT-PCR analysis of specific transposable elements. *** P< 0.0005.

