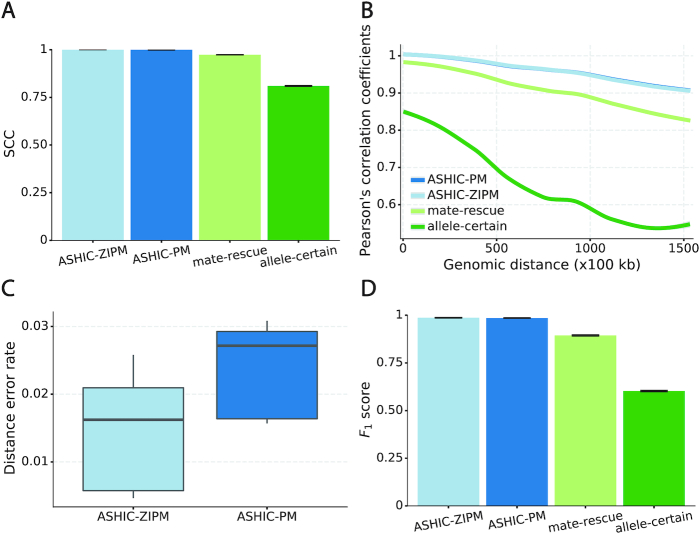
Figure 2.
Evaluation on simulated homologous X chromosome (Xa/Xi) data. (A) Stratum-adjusted correlation coefficients (SCCs) and (B) and Pearson’s correlation coefficients (PCCs) between the imputed diploid contact matrices and the true contact matrices. The PCC curves are smoothened using the locally weighted LOESS method. (C) Distance error rates between the predicted allelic 3D structures and the true structures. (D) F1 scores of the identified allele-specific chromatin interactions.

