Figure 6.
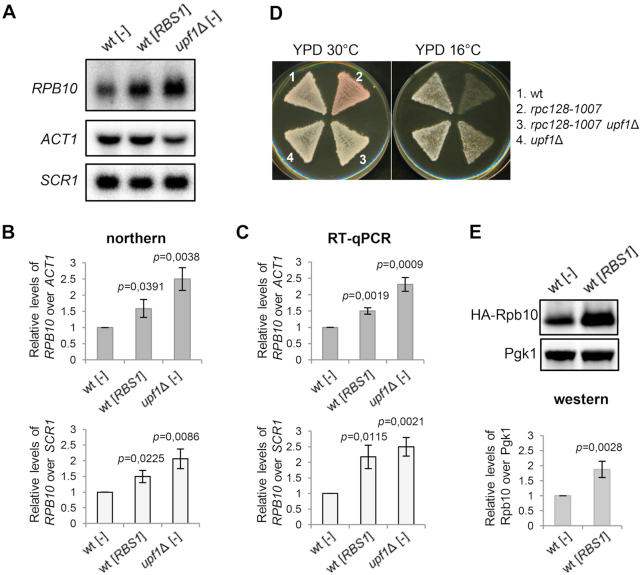
Effects of Upf1 and Rbs1 on RPB10 expression and Pol III assembly. (A–C) Opposite effects of Rbs1 and Upf1 on RPB10 mRNA levels. RNA was isolated from the upf1Δ mutant and a control strain (wt) that carried an empty vector [–] or the [RBS1] plasmid. RNA was independently analyzed by northern blot (A, B) and RT-qPCR (C). RPB10 mRNA levels were normalized to ACT1 mRNA (upper panel) or SCR1 (lower panel RPB10 mRNA levels were calculated relative to amounts in the wt strain, which was set to 1. (D) The phenotype of the Pol III assembly mutant rpc128-1007 was suppressed by upf1Δ. Cells that were grown on YPD plates were replicated on fresh YPD plates and incubated for 3 days at the respective temperatures. (E) Protein extracts were prepared from a control strain (wt) that carried an empty vector [–] or the [RBS1] plasmid additionally transformed with a centromeric [HA-RPB10] plasmid. The band corresponding to HA-tagged Rpb10 was quantified, normalized to Pgk1 signal used as a loading control and calculated relative to amounts in the wt strain, which was set to 1. Bars represent the mean ± standard deviation of three independent experiments. P values were calculated using a two-tailed t-test (B, C and E).

