Figure 3.
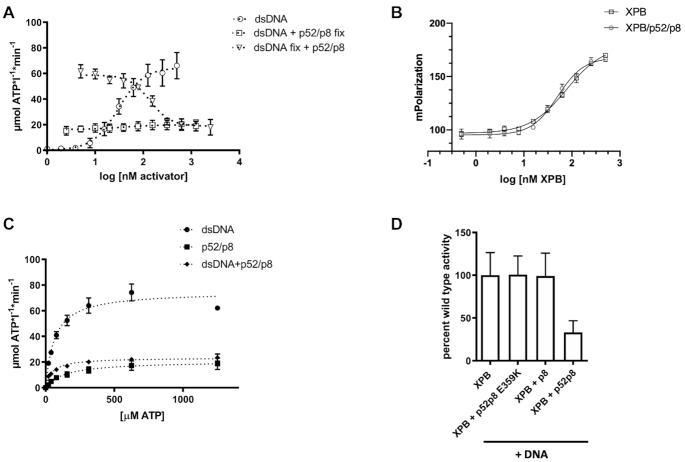
Influence of DNA and ATP binding on ctXPB’s ATPase activity. (A) Influence of dsDNA and ctp52/ctp8 on the ATPase activity of ctXPB. Increasing amounts of dsDNA were titrated onto fixed concentrations of ctXPB (open circles) and ctXPB with ctp52/ctp8 (open squares). Increasing amounts of ctp52/ctp8 were titrated onto fixed concentrations of ctXPB plus dsDNA (open triangles). The x-axis shows the logarithmic concentration of the respective activator complex that was titrated. The y-axis shows the NADH-consumption-derived ATP turnover rate in μmol ATP per liter per minute. N ≥ 4. (B) Fluorescence polarization measurements to investigate the influence of ctp52/ctp8 on ctXPB’s dsDNA binding ability. Increasing amounts of ctXPB (open squares) and ctXPB with ctp52/ctp8 (open circles) were titrated onto fixed amounts of fluorescently labeled dsDNA. The calculated kD values are listed in Table 2. N = 3. (C) ATPase activity profile with Michaelis Menten kinetics. Increasing amounts of substrate (ATP) were titrated onto different complexes of ctXPB with its activators dsDNA (circles), ctp52/ctp8 (squares) and dsDNA plus ctp52/ctp8 (rhombs). The x-axis shows the concentration of the respective activator complex. The y-axis shows the NADH-consumption-derived ATP turnover rate in μmol ATP per liter per minute. Vmax, KM, kcat and kcat/KM values for the different ctXPB activation complexes are listed in Table 3. N ≥ 3. (D) ATPase activity of ctXPB in the presence of dsDNA with or without different ctp52/ctp8 complexes. N ≥ 8.

