Figure 4.
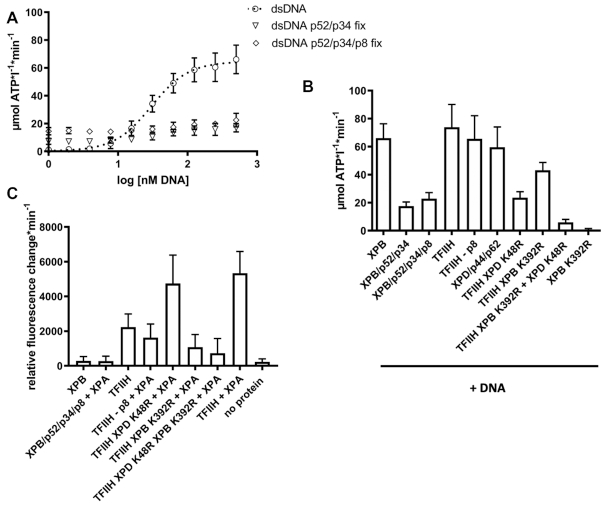
ATPase and translocase activities of ctXPB in core ctTFIIH. (A) ATPase activity profile of ctXPB activated by increasing amounts of dsDNA without ctp52 (open circles) and with fixed concentrations of ctp52/ctp34 (open triangles) and ctp52/ctp34/ctp8 (open rhombs). The x-axis shows the logarithmic concentration of dsDNA. The y-axis shows the NADH-consumption-derived ATP turnover rate in μmol ATP per liter per minute. N ≥ 6. The data for the dsDNA curve (open circles) were taken from Figure 3A for better comparison. (B) ATPase activity of core ctTFIIH and subunit complexes in the presence of dsDNA. The mean values and standard deviations for each condition are listed in Table 4. N ≥ 6. (C) DsDNA translocase activity of core ctTFIIH and different subunit complexes in the presence and absence of ctXPA. The mean values and standard deviations for each condition are listed in Table 4. N ≥ 11.

