Figure 1.
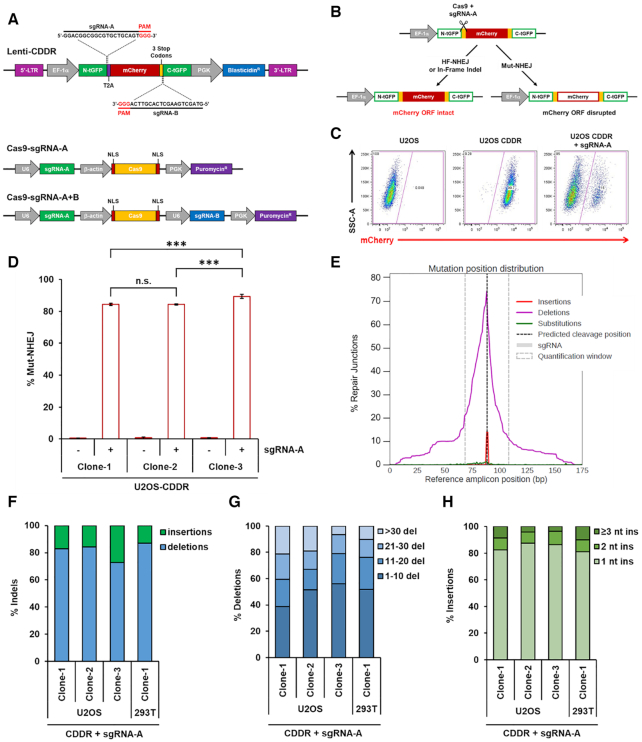
Detection and measurement of DSB repair using the CDDR reporter assay. (A) Schematic of the lenti-CDDR reporter (top) and Cas9–sgRNA-expressing plasmids (bottom). (B) Diagram of the phenotypic outcomes following the induction of single DSBs and subsequent repair within the CDDR reporter. (C) Representative FACS profiles of normal U2OS cells and U2OS-CDDR cells ± transfection with the Cas9–sgRNA-A plasmid. (D) Percentage of cells with single DSBs repaired via mutagenic non-homologous end-joining (Mut-NHEJ) in three independent clones of U2OS-CDDR cells. Mut-NHEJ is quantified as the percentage of mCherry-ve cells measured by FACS analysis after induction of DSBs and repair within the CDDR reporter. The percentage of mCherry-ve/GFP-ve cells is depicted using white columns with a red border throughout the study. Data represent the mean of three independent experiments ± standard deviation (s.d.). Statistical significance was determined using two-tailed Student's t-test; ***P< 0.001, n.s.: not significant. (E) Distribution of deep sequencing reads with insertions (red), deletions (purple), and substitutions (green) across the reference amplicon in U2OS-CDDR-Clone-1 cells. Indels are centered around the predicted sgRNA cleavage site (dotted line). Plot was generated with CRISPResso2 (35). (F) Frequency of deep sequencing reads categorized as insertions or deletions among total indels at the repair junctions in U2OS- and 293T-CDDR cells following the induction of single DSBs within the CDDR reporter. (G, H) Size distribution among deletions (G) and insertions (H) at the repair junctions in U2OS- and 293T-CDDR cells following the induction of single DSBs within the CDDR reporter.

