Figure 7.
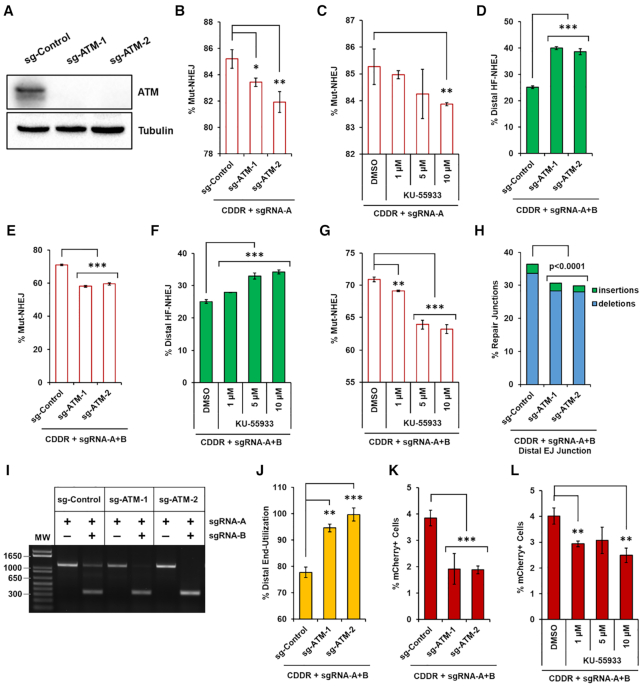
Loss of ATM promotes high-fidelity NHEJ and distal end-utilization. (A) Immunoblots of protein lysates from U2OS-CDDR-Clone-1 cells and clonal derivatives deleted of ATM. (B) Percentage of cells with single DSBs repaired via Mut-NHEJ (% mCherry-ve cells) following DSB induction in the indicated cell lines. Data represent the mean of three independent experiments ± s.d. Statistical significance was determined using two-tailed Student's t-test; *P<0.05, **P< 0.01. (C) Percentage of cells with single DSBs repaired via Mut-NHEJ (% mCherry-ve cells) following DSB induction in U2OS-CDDR-Clone-1 cells treated with DMSO or the indicated doses of ATM-specific inhibitor KU-55933. Data represent the mean of three independent experiments ± s.d. Statistical significance was determined using two-tailed Student's t-test; **P< 0.01. (D, E) Percentage of cells with DSBs repaired via distal HF-NHEJ (% GFP+ cells; D), or Mut-NHEJ (% mCherry-ve/GFP-ve cells; E) following the induction of two DSBs within the CDDR reporter in U2OS-CDDR-Clone-1 cells and clonal derivatives deleted of ATM. Data represent the mean of three independent experiments ± s.d. Statistical significance was determined using two-tailed Student's t-test; ***P< 0.001. (F, G) Percentage of cells with DSBs repaired via distal HF-NHEJ (% GFP+ cells; F) or Mut-NHEJ (% mCherry-ve/GFP-ve cells; G) following the induction of two DSBs within the CDDR reporter in U2OS-CDDR-Clone-1 cells treated with DMSO or the indicated doses of ATM-specific inhibitor KU-55933. Data represent the mean of three independent experiments ± s.d. Statistical significance was determined using two-tailed Student's t-test; **P< 0.01, ***P< 0.001. (H) Frequency of deep sequencing reads categorized as insertions or deletions at distal EJ junctions following the induction of two DSBs within the CDDR reporter in U2OS-CDDR-Clone-1 cells and clonal derivatives deleted of ATM. Statistical significance was assessed using chi-squared tests with Yates' continuity correction and Bonferroni correction. (I) Representative agarose gel displaying PCR amplification of the CDDR reporter in U2OS-CDDR-Clone-1 cells and clonal derivatives deleted of ATM and transfected with Cas9–sgRNA-A or Cas9–sgRNA-A+B. (J) Frequency of distal end-utilization following the induction of two DSBs within the CDDR reporter in the indicated cell lines. Data represent the mean of three independent experiments ± s.d. Statistical significance was determined using two-tailed Student's t-test; **P< 0.01, ***P< 0.001. (K) Percentage of mCherry+ cells following the induction of two DSBs within the CDDR reporter in U2OS-CDDR-Clone-1 cells and clonal derivatives deleted of ATM. Data represent the mean of three independent experiments ± s.d. Statistical significance was determined using two-tailed Student's t-test; ***P< 0.001. (L) Percentage of mCherry+ cells following the induction of two DSBs within the CDDR reporter in U2OS-CDDR-Clone-1 cells treated with DMSO or the indicated doses of ATM-specific inhibitor KU-55933. Data represent the mean of three independent experiments ± s.d. Statistical significance was determined using two-tailed Student's t-test; **P< 0.01.

