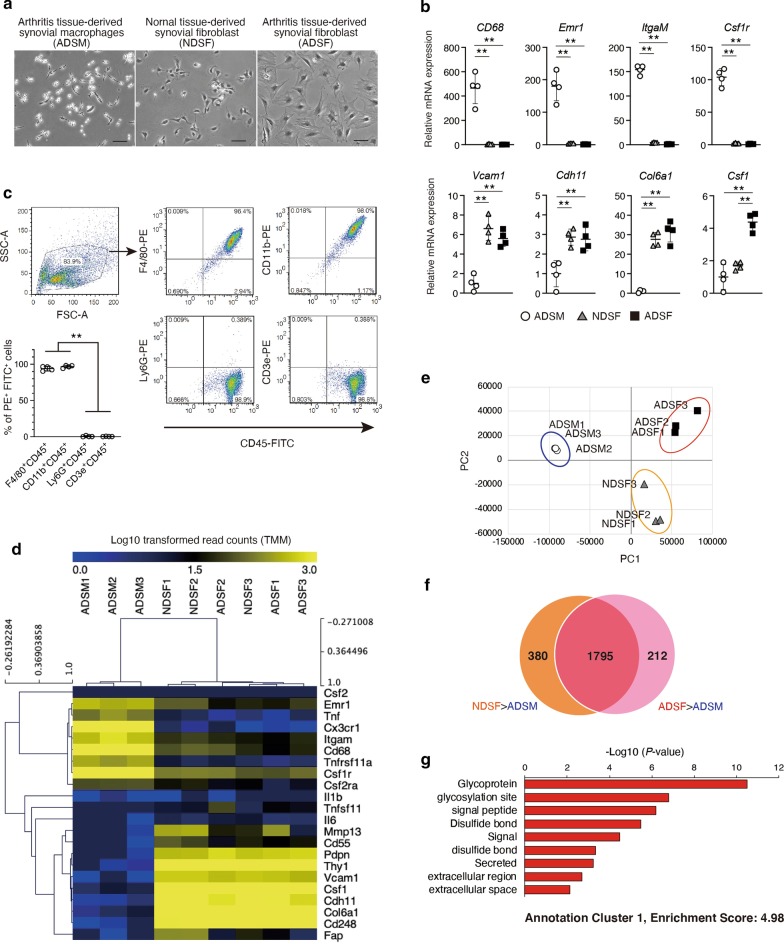
Fig. 2.
Gene expression profile in arthritis tissue-derived synovial macrophages (ADSM), normal tissue-derived synovial fibroblasts (NDSF) and arthritis tissue-derived synovial fibroblasts (ADSF). a ADSM, NDSF and ADSF were isolated from 4 independent ankles with or without CAIA. Representative phase-contrast images of ADSM, NDSF and ADSF. Scale bar represents 100 μm. b Gene expression of pan-macrophage and SF markers in ADSM, NDSF and ADSF were analyzed by RT-qPCR (n = 4). ** indicates P < 0.01 by ANOVA followed by Tukey’s test. Data are presented as average ± SD. c Pan-leukocyte marker (CD45), macrophage markers (F4/80, CD11b), B cell marker (Ly6G) and T cell marker (CD3e) were analyzed in ADSM by flow cytometry. Representative dot plots were shown. Percentage of FITC+ and PE+ were showed lower left graph (n = 4). ** indicates P < 0.01 versus Ly6G+ CD45+ and CD3e+ CD45+ by ANOVA followed by Tukey’s test. Data are presented as average ± SD. d Heatmap of selected genes in ADSM, NDSF and ADSF (n = 3). Log10 transformed read counts are scaled to 0.0 to 3.0. Rows and columns were ordered based on hierarchical clustering by MeV. e Principal-component analysis (PCA) displaying clusters of ADSM, NDSF and ADSF (n = 3). f Venn diagram for the number of specifically expressed genes in NDSF and ADSF. g Gene Ontology (GO) analyses were performed using DAVID Bioinformatics Resources. The top of enriched annotation cluster among 212 genes are illustrated by P-value. All data were obtained from 3–4 independent experiments using ADSM, NDSF and ADSF derived from 3 to 4 independent ankles with or without CAIA

