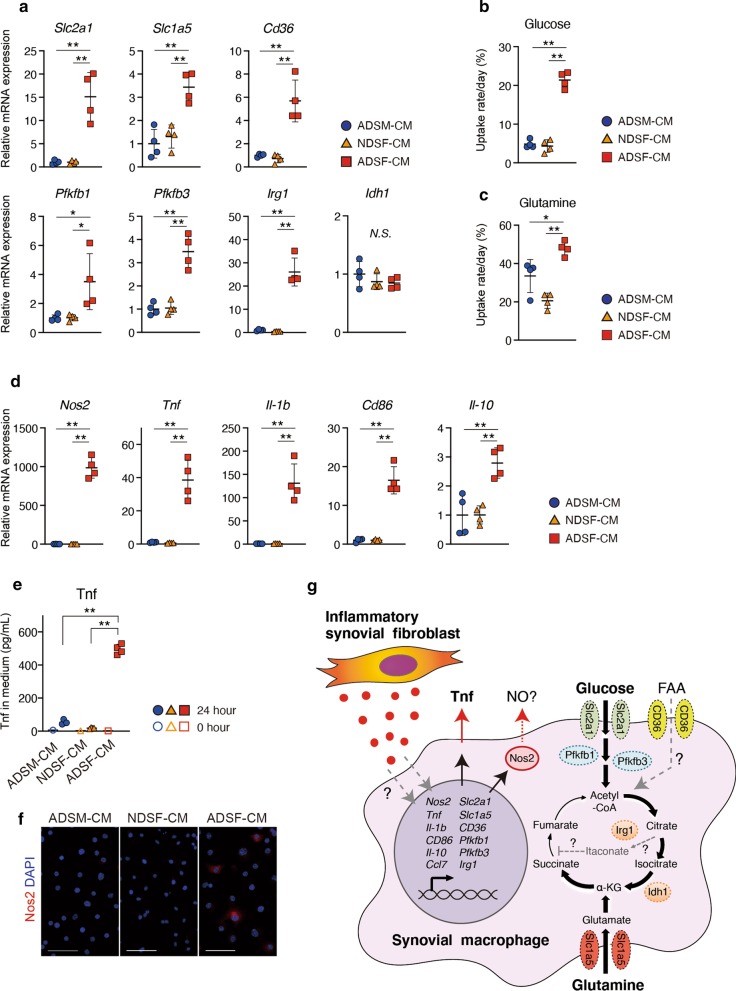
Fig. 4.
Metabolic reprogramming and immunological activation in ADSM. a Metabolic gene expression in ADSM treated with CM was analyzed by RT-qPCR (n = 4). b Glucose and c Glutamine uptake rate per 24 h were measured in ADSM treated with CM (n = 4). d Inflammatory and anti-inflammatory gene expression in ADSM treated with CM was analyzed by RT-qPCR (n = 4). e After culturing in CM for 0–24 h, the Tnf concentration in the medium was measured by ELISA (0 h; n = 1, 24 h; n = 4). f Immunocytochemical staining of Nos2 (red) and DAPI (blue) in ADSM treated with CM. Scale bar represents 50 μm. g Summarized schema in this study. * and ** indicate P < 0.05 and P < 0.01, respectively, by ANOVA followed by Tukey’s test. Data are presented as average ± SD. All data were obtained from 4 independent experiments using ADSM derived from 4 independent CAIA ankles

