Fig. 2.
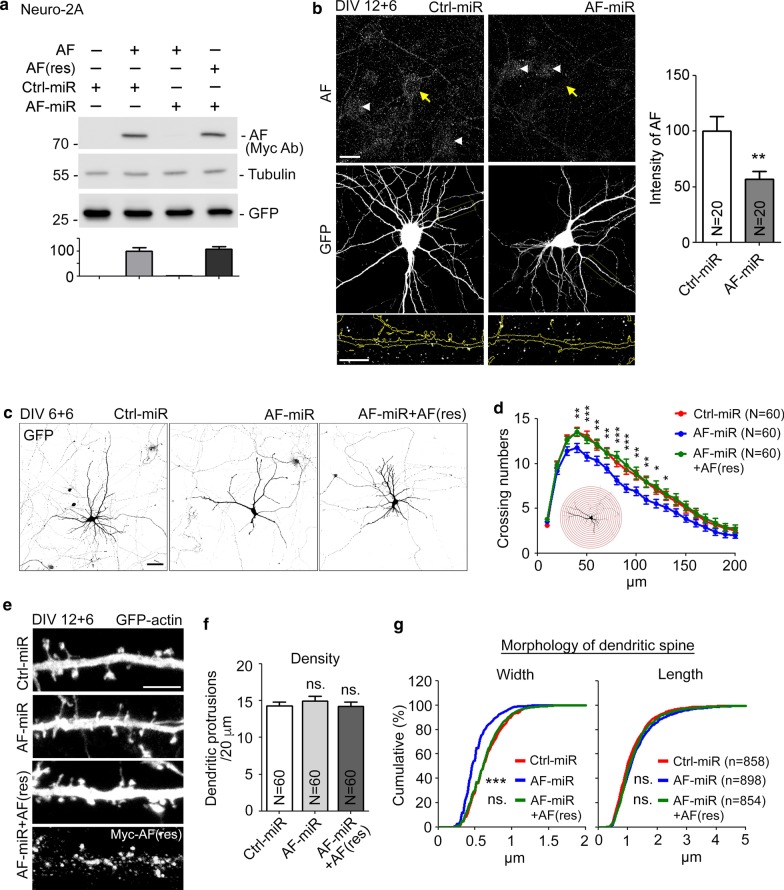
KLHL17/AF knockdown impairs dendritic arborization and spine formation. a The knockdown effect of AF-miR in Neuro-2A cells. Whole-cell extracts were collected and immunoblotted with Myc antibody to detect Myc-tagged AF and AF-miR-resistant AF-rescue construct (AF(res)). GFP and tubulin are loading controls. b AF-miR reduces endogenous KLHL17/AF protein levels in hippocampal neurons. Left: Cultured hippocampal neurons were transfected with the indicated plasmids at 12 DIV and harvested for immunostaining at 18 DIV. Since miRNA constructs coexpress GFP, GFP signals were used to outline miRNA-expressing neurons. Endogenous AF was detected using AF antibody. The AF signal in the soma was quantified. Yellow arrows and white arrowheads indicate transfected and non-transfected neurons, respectively. Enlarged images of dendrites (yellow box) are shown at bottom. Right: Quantification of knockdown efficiency. c–g Loss of KLHL17/AF impairs dendritic arborization (c–d) and spine formation (e–g). Cultured hippocampal neurons were transfected with the indicated plasmids at 6 (c–d) or 12 (e–g) DIV and then harvested for immunostaining at 12 (c–d) or 18 (e–g) DIV, respectively. AF knockdown reduces the complexity of dendrites and dendritic protrusion width, but not protrusion length or density. The AF-rescue construct AF(res) ameliorates the deficits of dendritic complexity and spine morphology caused by AF-miR. c, e Representative images. e The upper three panels show GFP signals. The lowest panel indicates expression of AF(res), as revealed by Myc tag antibody. f Quantification of protrusion density. g Quantification of the width and length of dendritic protrusions. N, the number of analyzed neurons (a, d) or dendrites (f); n, the number of analyzed dendritic protrusions. Samples were randomly collected from two independent experiments without knowing the treatment. Data represent the mean plus SEM. *P < 0.05; **P < 0.01; ***P < 0.001; ns, not significant. Scale bars: b 20 μm; enlarged inset, 10 μm; c 50 μm; e 5 μm. Unpaired t-test (b), two-way ANOVA (d), one-way ANOVA (f), Kolmogorov–Smirnov test for cumulative probability (g)

