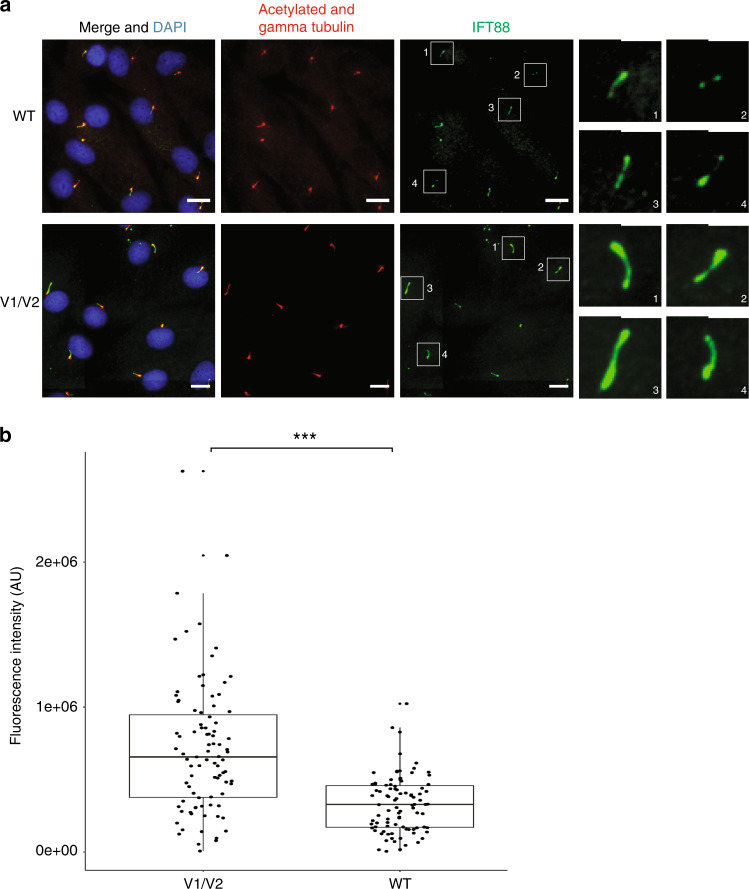
Fig. 4. Ciliated proband 1 fibroblasts accumulate IFT88 (green) in ciliary axonemes.
(a) Wild-type (WT) (top) and proband 1 V1/V2 mutant (bottom) fibroblasts are stained with acetylated alpha tubulin (cilia axonemes, red), gamma tubulin (basal body, red), and Hoescht (nuclei, blue). Scale bars are 18 µm. Panels on the right show enlargements of boxed ciliary IFT88 staining. Scale bars are 2 µm for enlargements. (b) Boxplot represents the distribution of IFT88 fluorescence intensity in proband 1 V1/V2 mutant and WT fibroblast cells. Data points are overlaid onto the boxplot to highlight the overlapping fluorescence intensity measurements in patient and WT cells. IFT88 fluorescence intensity was measured in 100 patient’s? and 100 WT cilia. ***P < 0.0001 (Student’s unpaired t-test).

