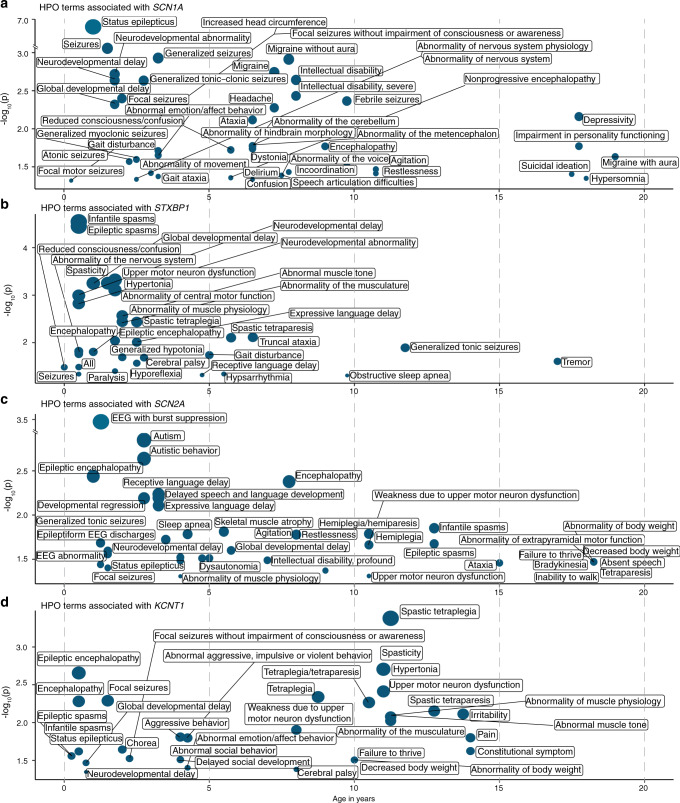
Fig. 4. Genetic etiologies demonstrate time-dependent phenotypic associations.
Phenotypic features associate with discrete genetic etiologies at specific time points when binned into 3-month intervals. Clinical terms associated with individual genes occur at different time intervals. The Human Phenotype Ontology (HPO) terms associated with (a) SCN1A, (b) STXBP1, (c) SCN2A, and (d) KCNQ2 are shown as an example with only the time interval with the most significant association for each HPO term shown. X-axis denotes patient age, y-axis denotes −log10 of the p value (Fisher’s exact test). EEG electroencephalogram.

