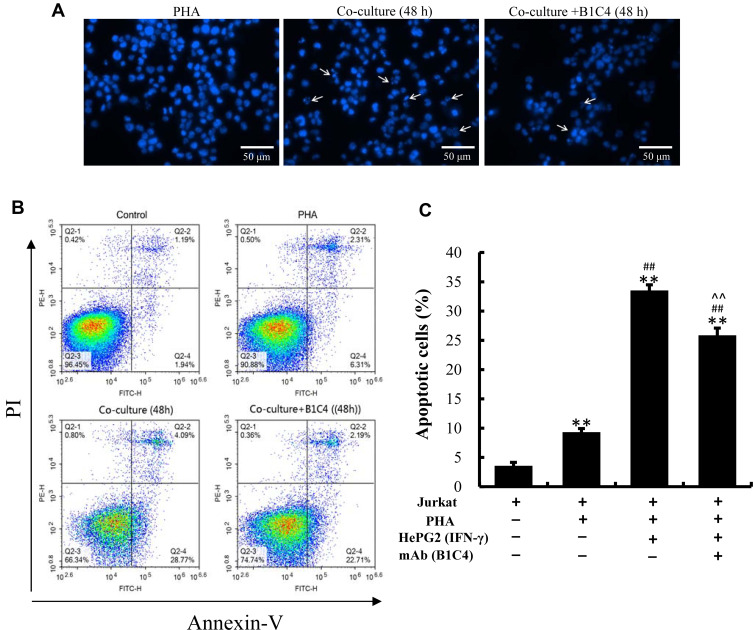
Figure 5.
mAb B1C4 inhibited the apoptosis of Jurkat cells induced by co-culture with HePG2 cells. (A) Jurkat cells stained with DAPI for cell nuclei and observed under laser-scanning confocal microscopy. White arrows indicate condensed chromatin, marginalization or nuclei fragmented into apoptotic bodies. (B, C) Apoptosis of Jurkat cells estimated using a flow cytometer. Jurkat cells without activation by PHA were used as controls. The bar graphs show the percentage of apoptotic cells for each of the indicated conditions. The data are presented as the mean ± S.D. (n=3), **p<0.01 vs control; ##p<0.01 vs the PHA-activated Jurkat cells; ^^p<0.01 vs Jurkat (PHA)+HepG2 (IFN-γ).

