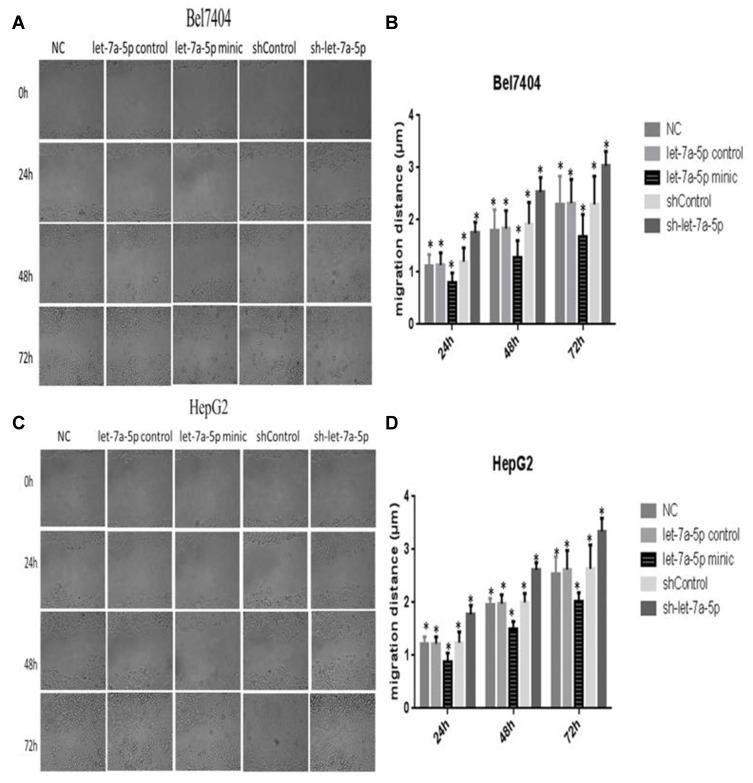
Figure 4.
The migration distance of Bel7404 cells in the let-7a-5p mimic group was lower than that in the let-7a-5p control group, and the migration distance of cells in the sh-let-7a-5p group was higher than that in the shControl group (A). Quantitative analysis of migration ability in Bel7404 cells (B). The migration distance of HepG2 cells in the let-7a-5p mimic group was lower than that in the let-7a-5p control group, and the migration distance of cells in the sh-let-7a-5p group was higher than that in the shControl group (C). Quantitative analysis of migration ability in HepG2 cells (D). *Indicates that the difference between the treated and control cells was statistically significant (P < 0.05).

