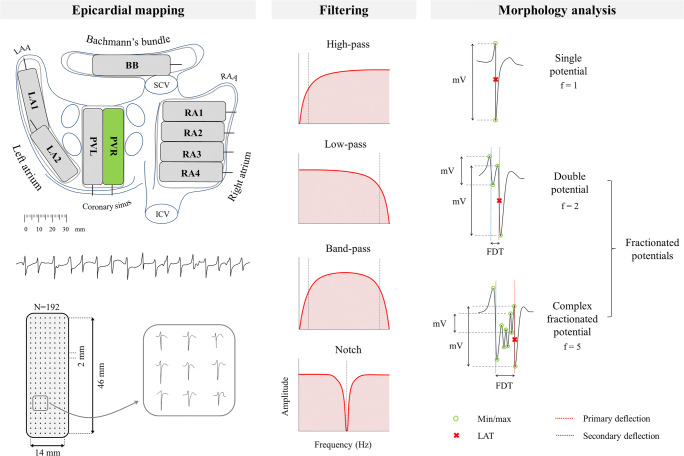
Fig. 1.
Schematic representation of mapping analysis. Left: the right pulmonary vein (PVR) area is mapped from the sinus transversus fold along the borders of the PVR down towards the atrioventricular groove. Using a 192-electrode array 10 s of AF is recorded. Middle: simplistic illustration of different filtering modes. Right: morphology analysis of all fibrillation potentials. The peak-to-peak amplitude of each deflection (mV), fractionation (f, number of deflections), and fractionation delay time (FDT) is derived. Fibrillation potentials were classified as either single potential (f = 1), double potential (f = 2), or complex fractionated potential (f ≥ 3). The steepest deflection of a potential is classified as the primary deflection (and marked as the local activation time), whereas additional deflections are classified as secondary deflections. BB, Bachmann’s bundle; ICV, inferior caval vein; LA, left atrium; LAA, left atrial appendage; LAT, local activation time; PVL, left pulmonary vein; RA, right atrium; RAA, right atrial appendage; SCV, superior caval vein

