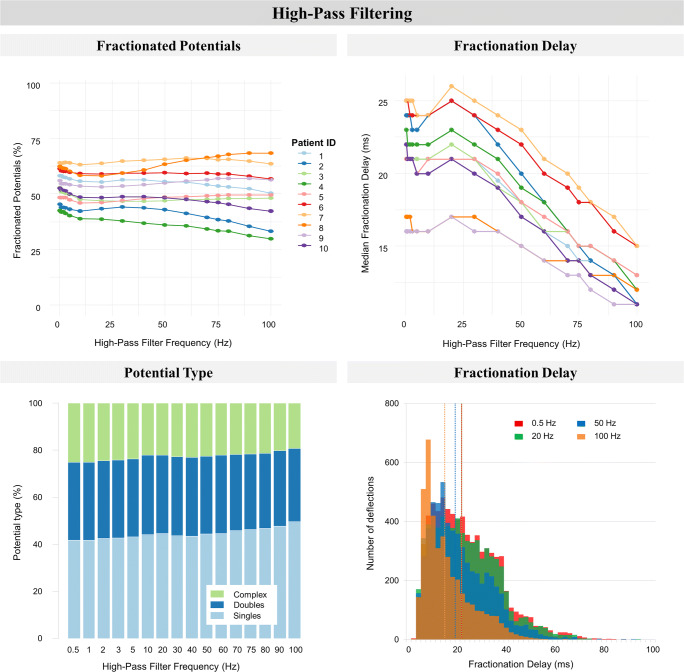
Fig. 4.
The impact of high-pass filtering on fractionation. Upper left: the percentage fractionated potentials (two or more deflections per potential, expressed as a percentage of total detected fibrillation potentials) of all patients. Upper right: fractionation delay time (FDT, time interval between first and last deflection) of all patients. Lower left: stacked bar-plots of potential types obtained from one patient. Potential type is either single (one deflection), double (two deflections), or complex (three or more deflections) and expressed as a percentage of the total number of detected fibrillation potentials. Lower right: stacked bar-plots of median FDT obtained from one patient. The dotted vertical lines represent the median value of the corresponding stacked bar-plot representing high-pass filtering at 0.5, 20, 50, or 100 Hz. For both lower figures, the data of patient 1 was taken as a representative case for all patients

