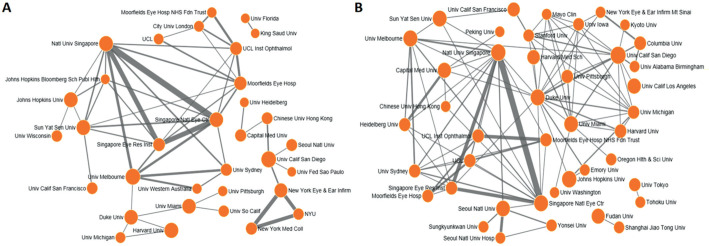
Figure 2. The co-occurrence map of the top 50 authors' institutions with the greatest number of articles in the first (A, 2009-2013) and second (B, 2014-2018) halves of the decade from 2009 to 2018.
Organization only; the larger the circle in the figure, the larger the number of articles published by the organization. The thicker the lines, the higher the cooperation frequency between the organizations. The line will be only displayed when cooperation article numbers are no less than 20.

