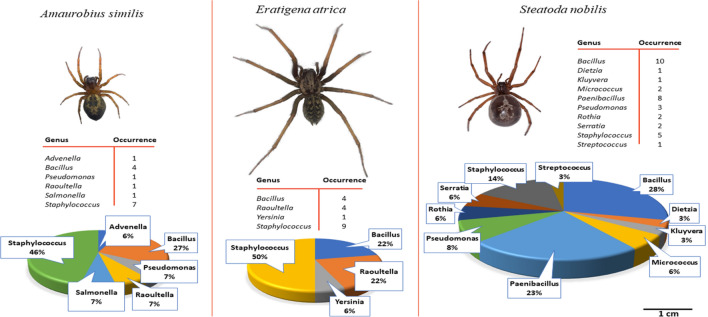
Figure 1.
Comparison of the bacterial community composition and relative abundances from body and chelicerae surfaces of A. similis, E. atrica and S. nobilis. Photographs of the spider species are shown to scale. Data of chelicerae isolates are displayed for A. similis and E. atrica, and combined data of both chelicerae and body isolates are displayed for S. nobilis. The tables display the number of times isolates of each bacterial genus was isolated from a spider species. The pie chart displays the relative abundance of the bacteria genera isolated.

