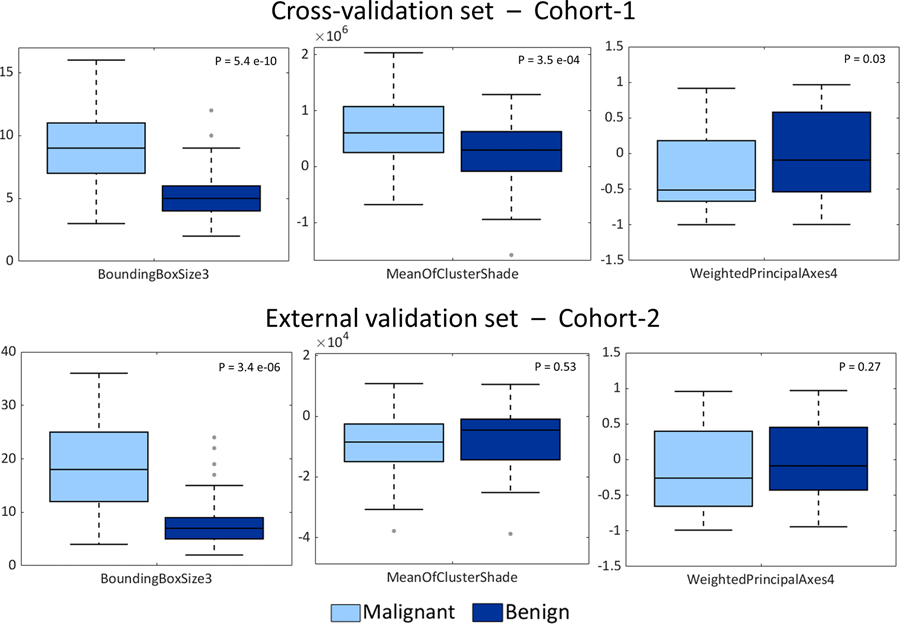
Fig 5.
Comparison of malignant nodules and benign nodules distributions for the three selected features for ANN model: BoundingBoxSize3 (left panels), MeanOfclusterShade (central panels) and WeightedPrincipalComponent (right panels). Panels on the top are related to the cross-validation set while panels on the bottom represent distributions of external validation-set features. For each pair of distributions p-values resulted from the Wilcoxon rank sum test are reported (alpha=5%).

