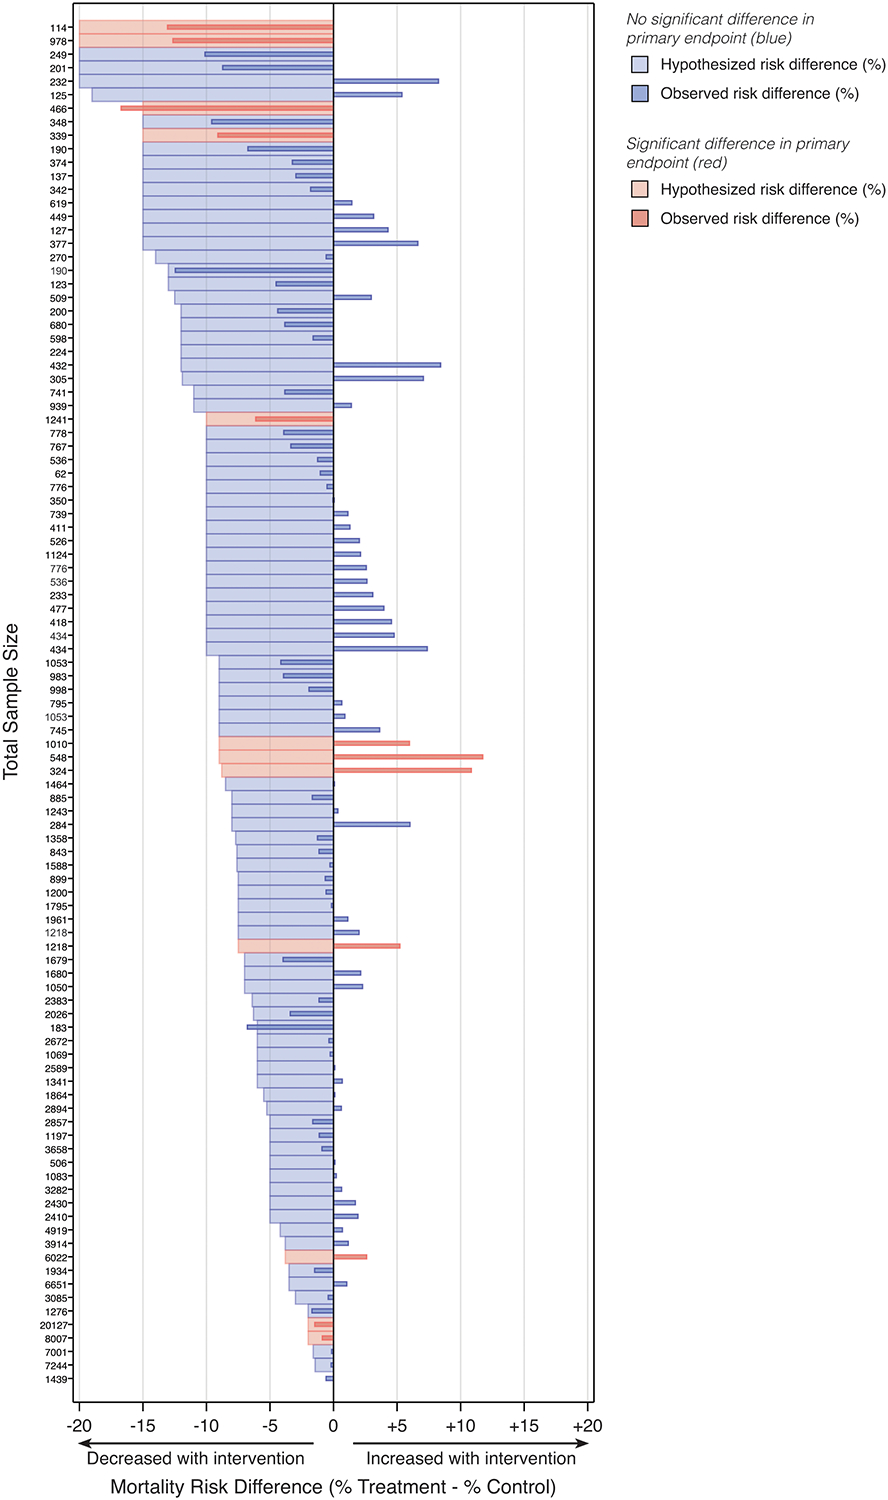
Figure 2. Butterfly plot of predicted and observed mortality risk difference.

Data are sorted by sample size within each study type. One trial (sample size 1,439 patients) contained insufficient information in its reported power and sample size determination to identify predicted risk difference.
