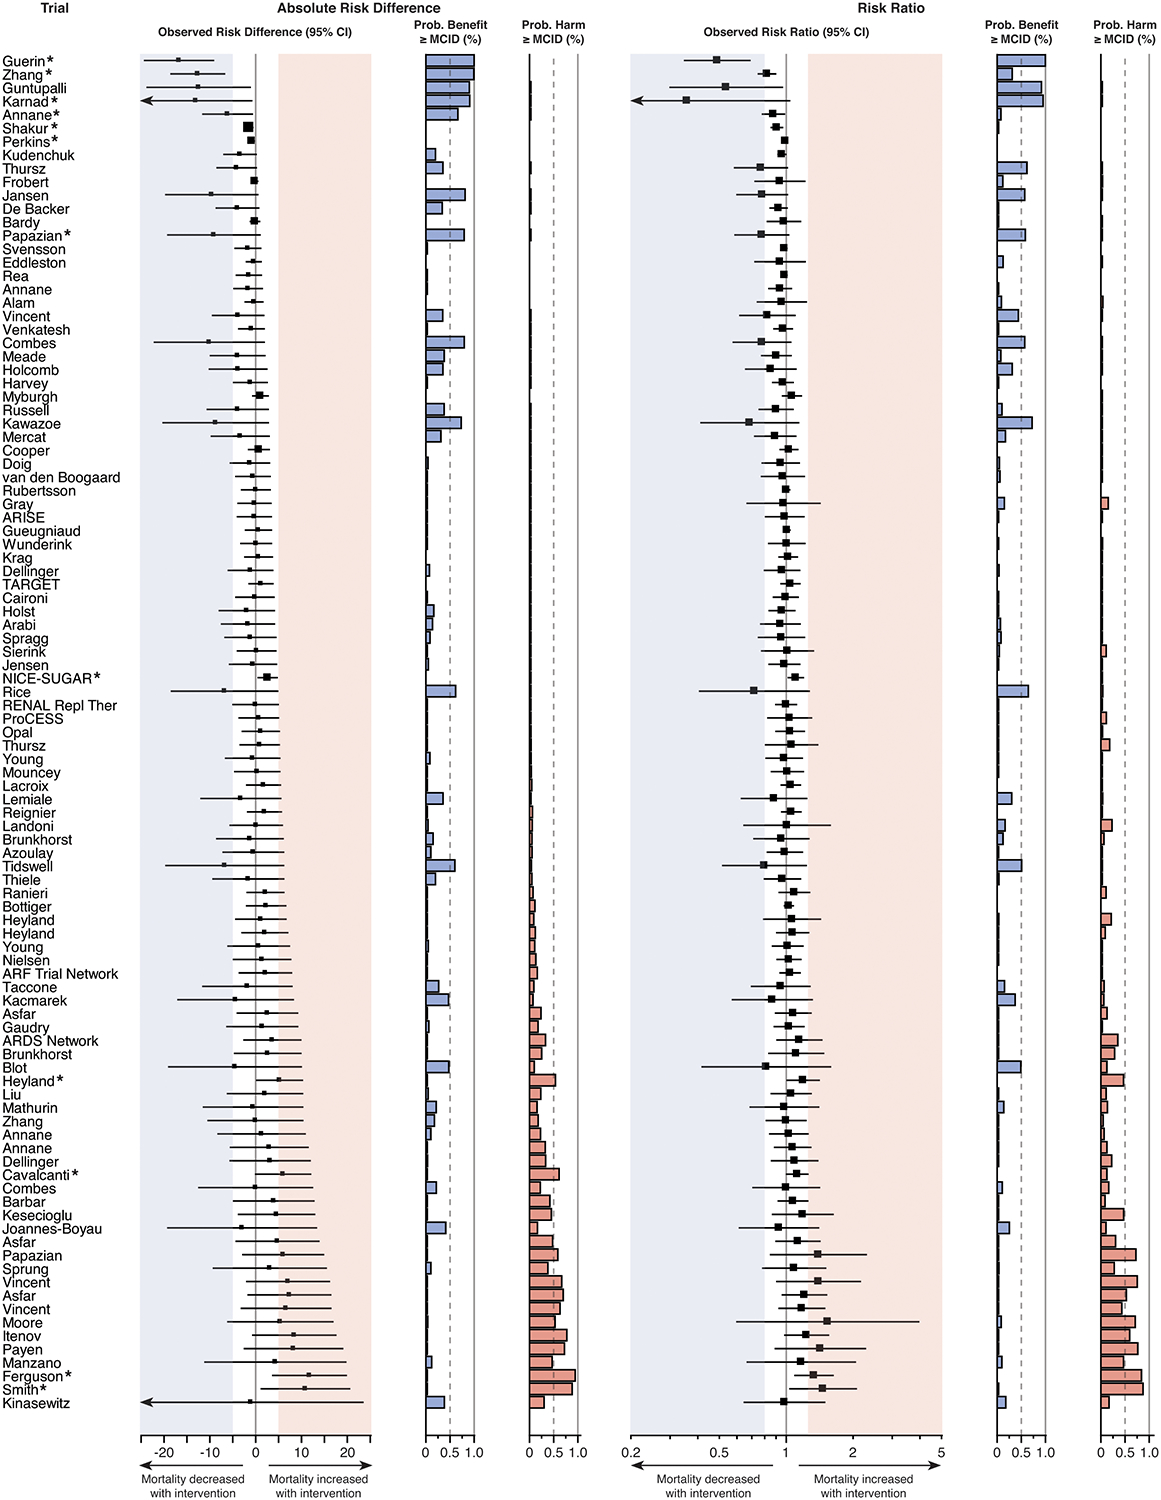
Figure 4. Trial results according to clinically important difference in mortality on absolute and relative scales.

Several trials that did not achieve statistical significance in conventional frequentist analysis nevertheless failed to exclude clinically important benefit or harm for the intervention studied. The prespecified threshold used for MCID was a 5% absolute risk difference (number needed to treat = 20) or 20% relative risk difference (risk ratio ≤ 0.8 or ≥ 1.2) for either benefit or harm with treatment. Thresholds are indicated by the shaded areas: blue for benefit and red for harm. Forest plots indicate the effect estimate and 95% confidence interval for absolute risk difference (left) and risk ratio (right) for each trial. The size of each square corresponds to the trial sample size relative to other included trials. The probability of a clinically important treatment effect (benefit or harm), given the trial results, was calculated for both the absolute risk difference and risk ratio using Bayesian statistics. MCID = minimal clinically important difference. * denotes statistical significance according to the trial’s main analysis.
