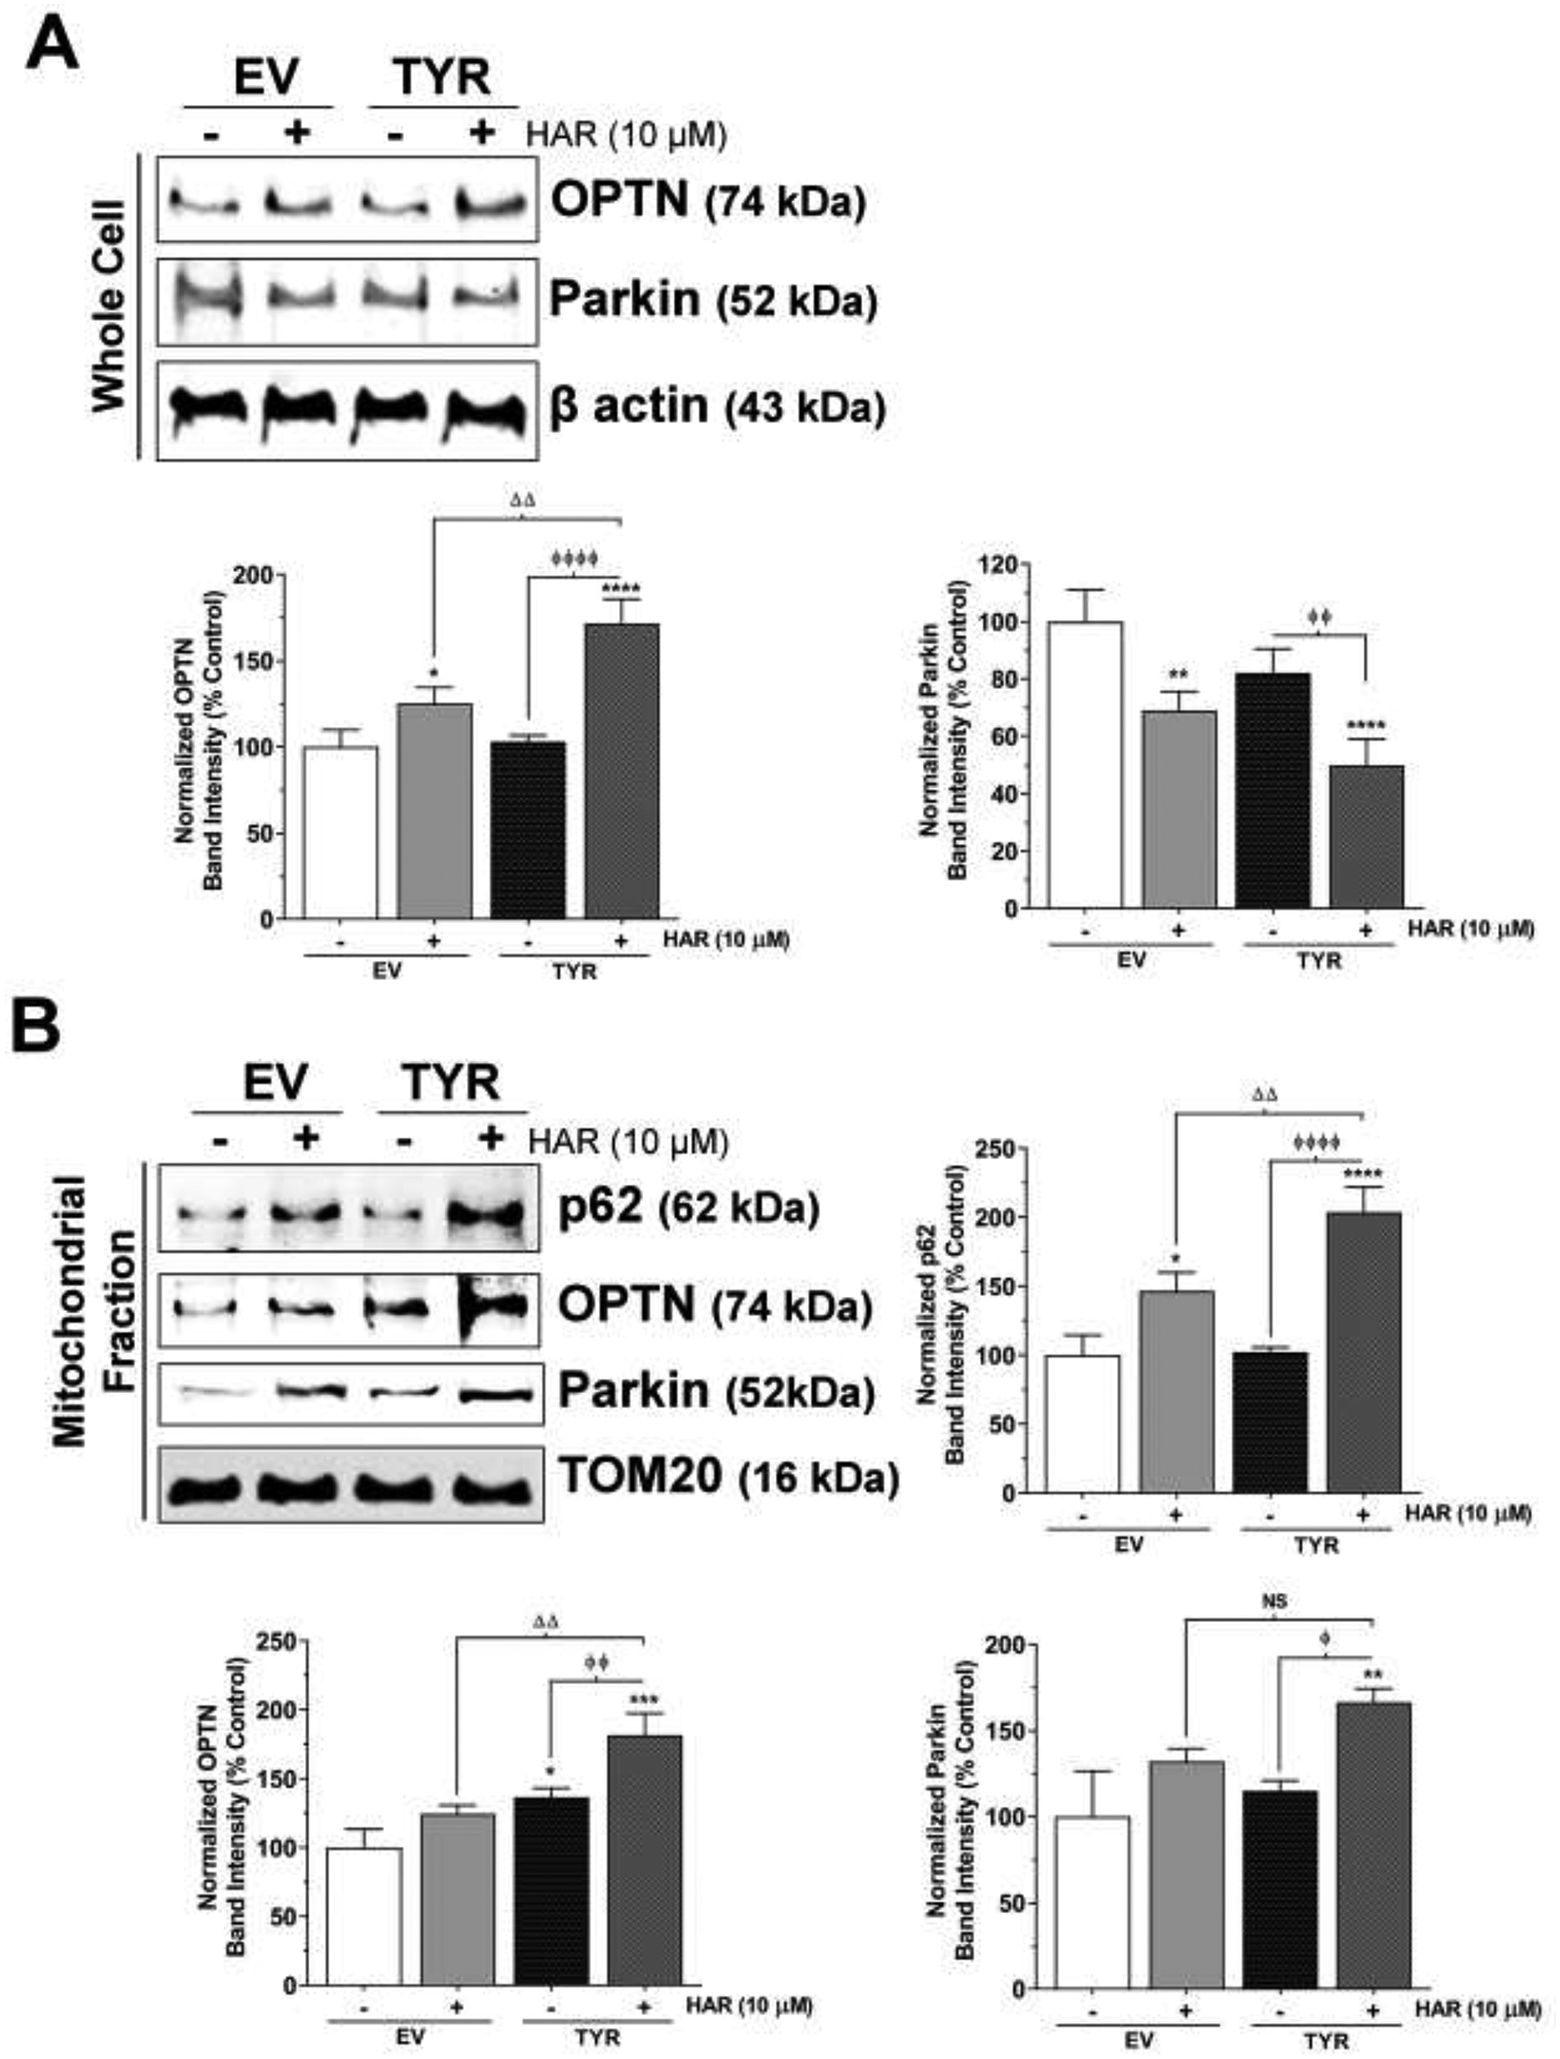
Figure 6. Neuromelanin modulates mitophagy in harmane-exposed SH-SY5Y cells.

SH-SY5Y cells were transfected with TYR to express melanin in vitro, while EV transfected cells were used as control cells. EV and TYR SH-SY5Y cells were treated with 10 μM HAR for 24 h. A. Representative immunoblot showing expression of OPTN and parkin in whole cell lysates of EV or TYR-transfected HAR-treated cells. β actin was used as a loading control. B. The bar histogram represents the normalized densitometry of respective proteins. The data are represented as mean ± SEM, n = 4. C. Representative immunoblot showing expression of p62, OPTN and parkin in mitochondrial fraction of EV or HAR-transfected HAR-treated cells. TOM20 was used as a loading control. D. The bar histogram represents the normalized densitometry of respective proteins. The data are represented as mean ± SEM, n = 3. *p<0.05, **p<0.01, ***p<0.001 and ****p<0.0001 vs EV Control group; ɸp<0.05 and ɸ ɸ ɸp<0.05 vs TYR Control cells; and Δ Δp<0.01 and Δ Δ Δp<0.001 vs EV HAR-treated cells. NS= not significant.
