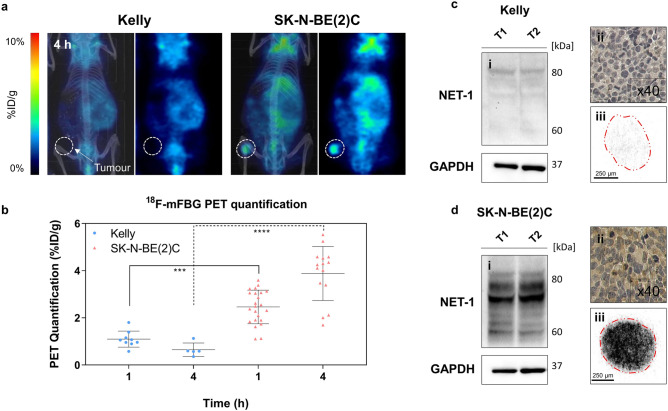
Figure 3.
PET analysis of 18F-mFBG distribution and NET-1 expression profile. (a) Representative coronal slice of Kelly (left) and SK-N-BE(2)C (right) xenograft PET images with corresponding maximum intensity projection CT overlay, 4 h p.i. of 18F-mFBG. Dotted circles represent tumour region. (b) PET quantification of Kelly and SK-N-BE(2)C xenografts 1 and 4 h p.i. of 18F-mFBG. Data are presented as mean ± SD, n ≥ 5 per group, each dot represents one tumour. ***p < 0.001, ****p < 0.0001; Student’s t-test. Ex vivo analysis of Kelly (c) and SK-N-BE(2)C (d) xenografts (i) Western blot (n = 2) (Full-length blots are presented in Supplementary Figure WB2) (ii) immunohistochemistry of NET-1 protein (× 40) and (iii) autoradiography exposition of tumour section, 2 h on to X-ray film. Graph is generated using GraphPad Prism (v 8.4.1), https://www.graphpad.com.

