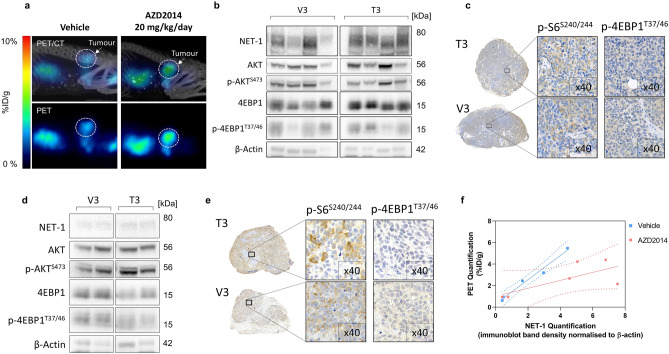
Figure 5.
In vivo assessment of AZD2014 and 18F-mFBG uptake. (a) PET/CT of SK-N-BE(2)C xenografts. PET image and corresponding maximum intensity projection CT overlay, 4 h p.i. of 18F-mFBG in vehicle (left) and AZD2014 (20 mg/kg/day)(right) treated mice, 3 days. Tumours highlighted with dotted white circle. (b) Western blot (n = 4) and (c) IHC analysis of SK-N-BE(2)C tumour lysates of animals treated for 3 days with vehicle (V3) or AZD2014 20 mg/kg/day (T3). (d) Western blot (n = 2) and (e) IHC analysis of Kelly tumour lysates treated for 3 days with vehicle (V3) or AZD2014 25 mg/kg/day (T3). (f) Linear regression fit of NET-1 band density vs PET mean quantification in vehicle (r2 = 0.98) and AZD2014 (r2 = 0.53) treated tumours (n = 5–6 per group). For Western blots, full-length blots are presented in Supplementary Figures WB3 and WB4. Graph is generated using GraphPad Prism (v 8.4.1), https://www.graphpad.com.

