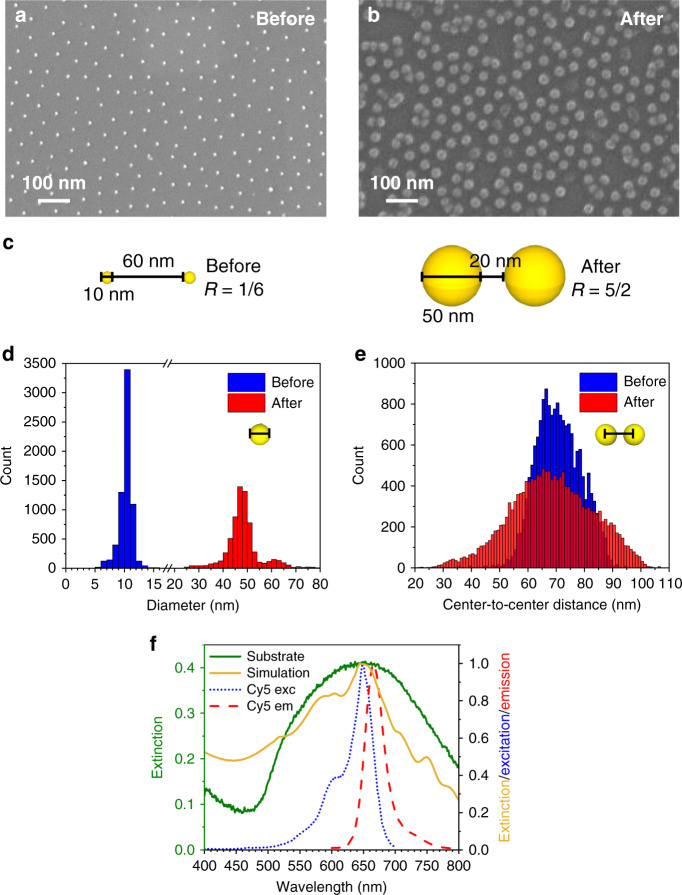
Fig. 3. Substrate characterization.
a, b Top view SEM images of the AuNP array show high regularity of nanoparticle shape and size. Defects arising during the AuNP growth step, such as clusters and holes are randomly distributed on the substrate. c Sketch of the AuNP growth process. The nanoparticle diameter increases approximately five-fold while the interparticle distance reduces three-fold by holding the lattice period (center-to-center distance among nearest neighbors) equal to ~70 nm. The R value goes from ~0.17 to ~2.5 warranting a collective plasmonic behavior of the AuNPs immobilized on the substrate. d Histograms of nanoparticle diameter before (blue columns) and after (red columns) incubation with gold growth solution. The distributions are peaked at ~11 nm and ~48 nm, respectively. e Center-to-center distance histograms exhibit similar distributions confirming the holding of most of AuNP positions also after the gold growth process. The wider distribution delivered by the substrates after the AuNP growth (red columns) is due to the presence of lattice irregularities and defects arising during the incubation process. f The experimental extinction spectrum of the substrate (green continuous line) is well reproduced by simulating the optical response provided by the actual substrate morphology as measured by SEM (gold continuous line). The excitation and emission peaks of Cy5 (dotted blue line and dashed red line, respectively) are encompassed within the substrate plasmon resonance.

