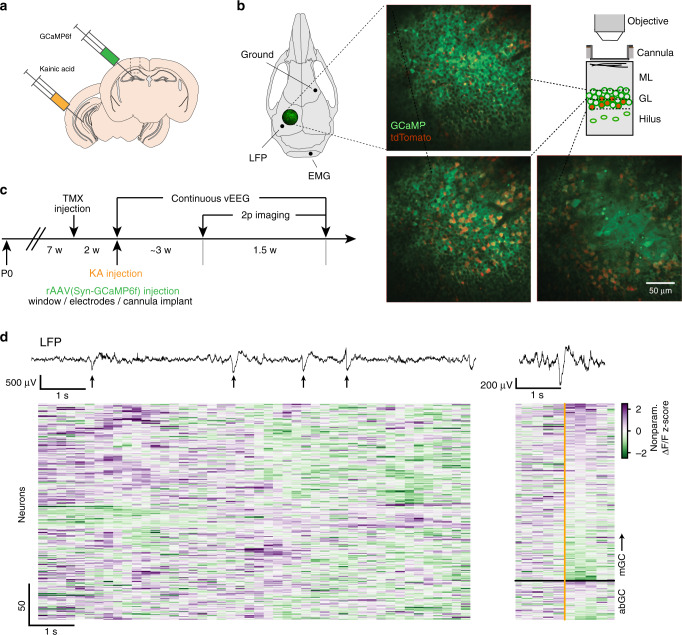
Fig. 1. Cell-type specific functional imaging in the dentate gyrus.
a Experimental schematic. GCaMP6f is virally expressed in all DG neurons at the dorsal HPC site of injection, and kainic acid (KA) is injected into the ipsilateral ventral HPC to induce the model of epilepsy. b Left: Schematic of skull showing locations of imaging window, ipsilateral local field potential (LFP) electrode, electromyography (EMG), and ground electrode placements. Center: Two-photon line-scanning microscopy allows for the recording of large populations of GCs in surgically exposed dorsal DG. Representative example in vivo two-photon two-color microscopy time average images from near simultaneous multi-plane imaging in the mouse DG. The top two planes are focused in the dorsal GC layer while the bottom plane is located just above the polymorphic hilar region. Green represents GCaMP fluorescence in all cell types, while red represents tdTomato expression limited to abGC in a Cre-dependent manner. Right: Schematic showing near-simultaneous multiplane imaging throughout the DG granule cell layer. ML molecular layer, GL granule cell layer. c Experimental timeline for the labeling of abGCs, induction of the kainate model, and two-photon imaging of the epileptic DG network (n = 5 mice). Adult-born GCs were indelibly labeled with tdTomato following injections of tamoxifen (TMX) that drove expression of Cre in Nestin+ cells. Two weeks later, KA was injected into the ventral HPC and GCaMP6f was injected into the dorsal DG and chronic imaging window cannula was implanted above the dorsal DG. Following injection of KA, mice were monitored for ictal activity using continuous video-EEG. d Top: Filtered LFP showing interictal epileptiform discharges (arrows) in an IHK mouse 31 days after KA injection. Left: Example abGC and mGC whole population activity during IEDs across a 10 second time window. Activity for each neuron is shown as a positive (purple) or negative (green) nonparametric z-scored ΔF/F, clipped to ±2.5z for visualization. Right: LFP trace and population activity from the same abGCs and mGCs centered on an example IED (orange) across a 2 s time window and sorted by maximum activity.

