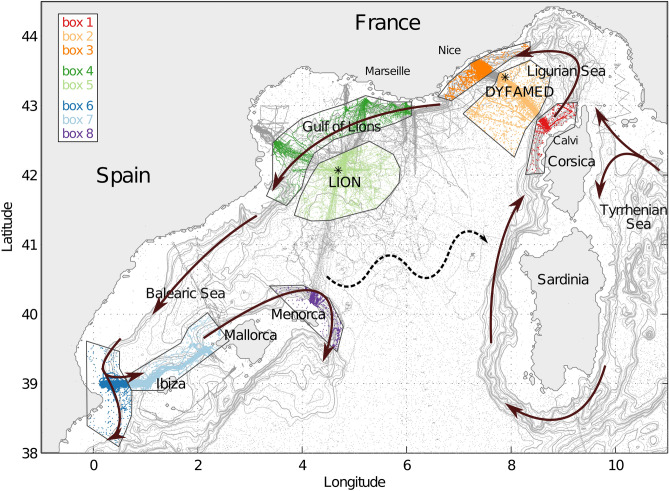
Figure 1.
Color-coded regional areas: orange Ligurian Sea, green Gulf of Lion and blue Balearic Sea. Each region is decomposed in sub-regions defined by the general circulation. The scattered dots represent all the profiles collected between 01/01/2007 and 01/01/2018 in the respective regional areas in color and outside in grey. The two mooring locations (LION and DYFAMED) are indicated by the black stars. The LIW general circulation is indicated by the arrows and the north Balearic Front by the dashed one. The background map was generated with ETOPO5 (Data Announcement 88-MGG-02, Digital relief of the Surface of the Earth. NOAA, National Geophysical Data Center, Boulder, Colorado, 1988).

