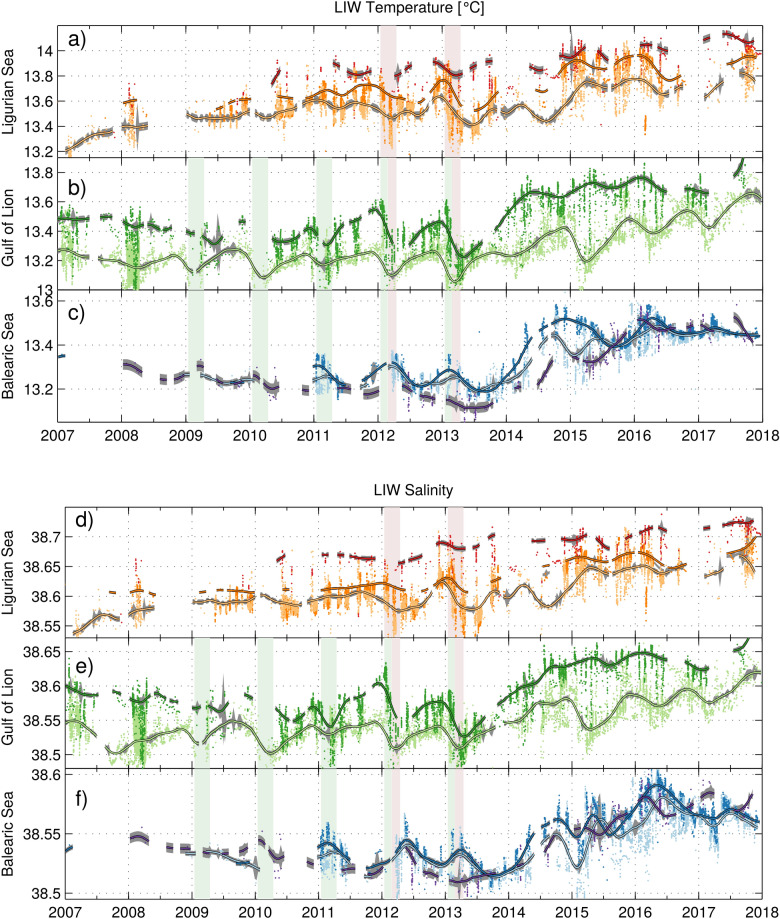
Figure 2.
Temperature and salinity 2007–2018 time series in the: (a,d) Ligurian Sea, (b,e) Gulf of Lion and (c,f) Balearic Sea . The color-code is that of Fig. 1. The winters with deep convection in the Ligurian Sea and the Gulf of Lion are indicated by purple and green vertical patches, respectively. The black contoured curves represent the 90-day running mean and the grey patches around them the running standard error in each regional subset of data (the very large number of points explains its low value).

